Author: skp_admin

  • The Process: What it actually took to build Time is Money

    The Process: What it actually took to build Time is Money

    The Process: How I Talked My Way Into Building a Watch Research Platform

    A companion post to “Time is Money” — the story behind the story.

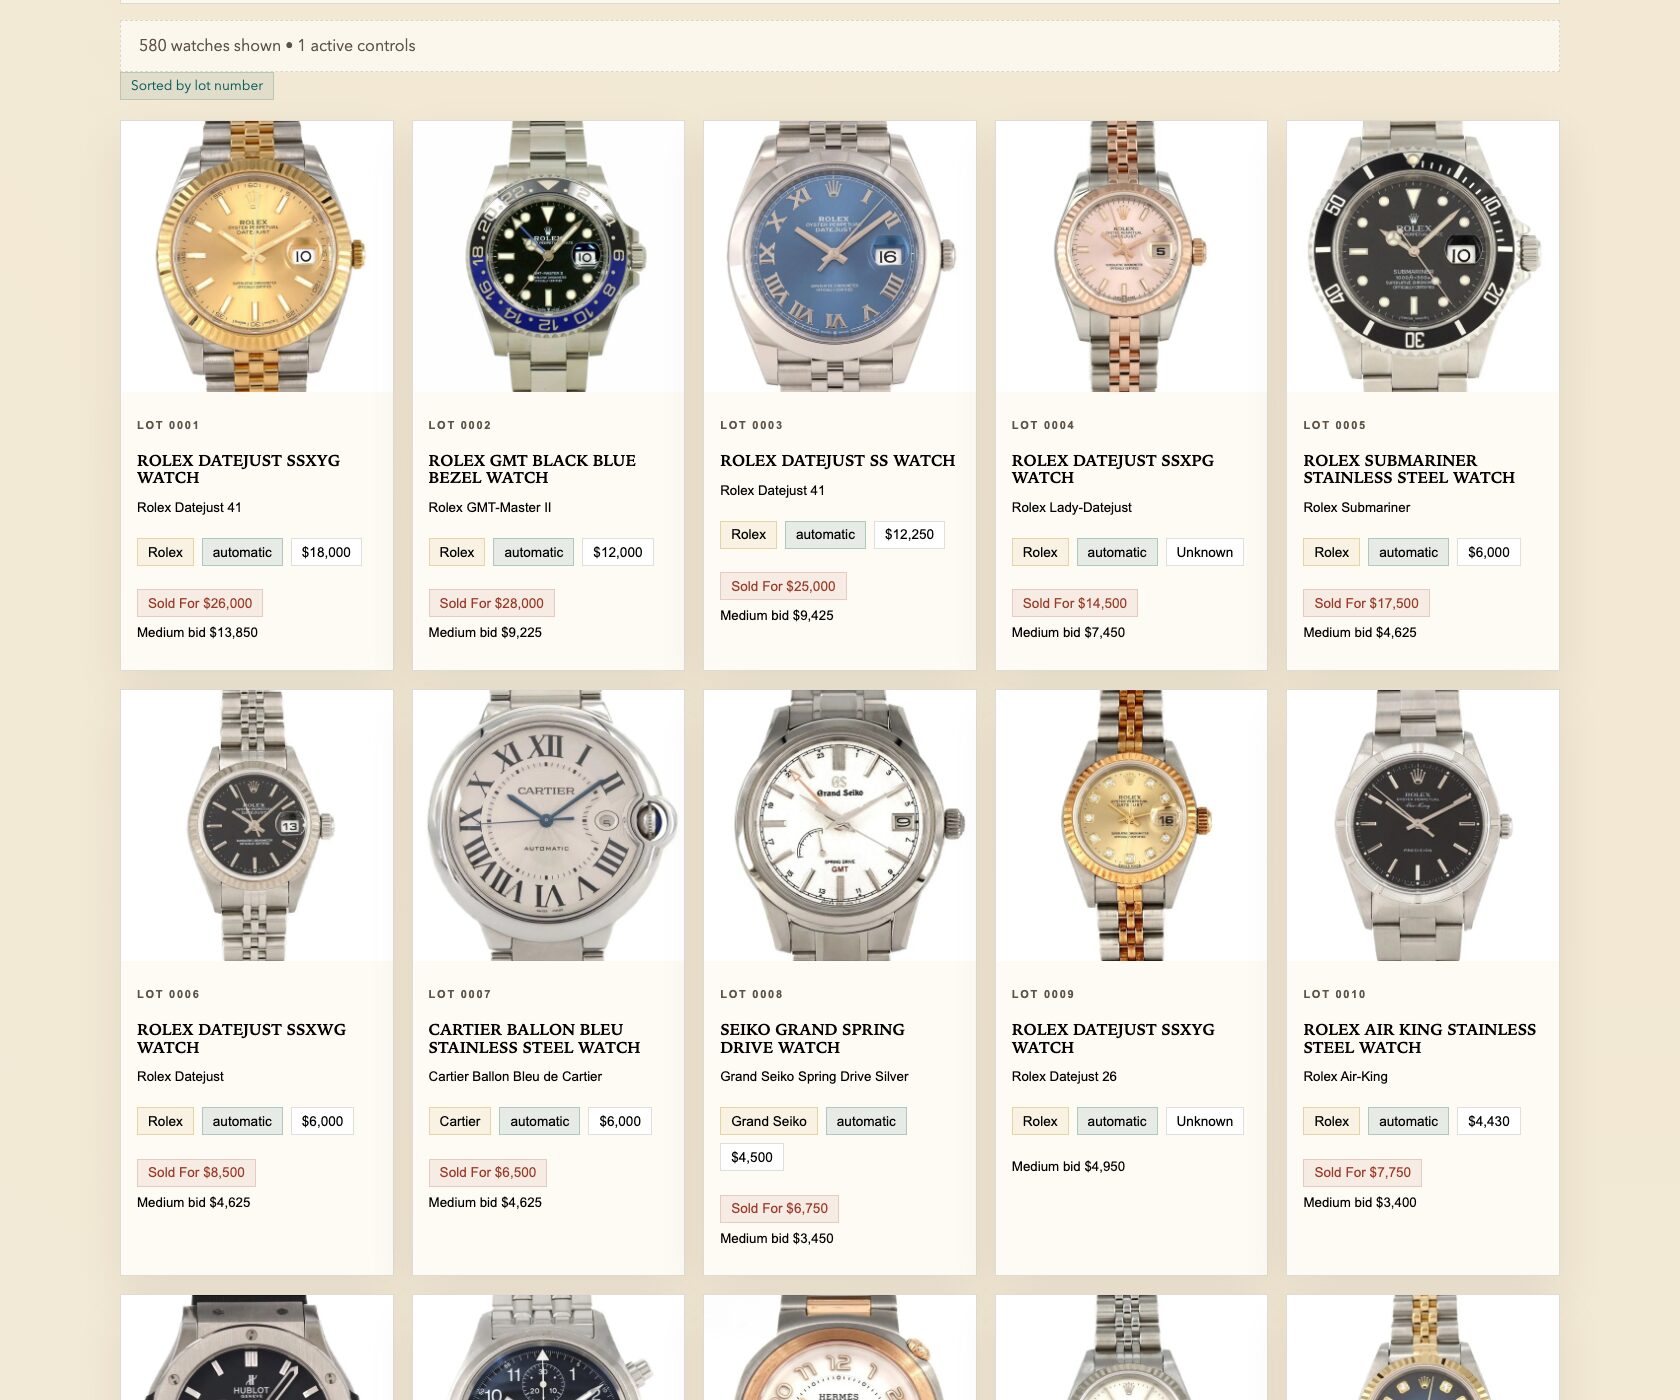
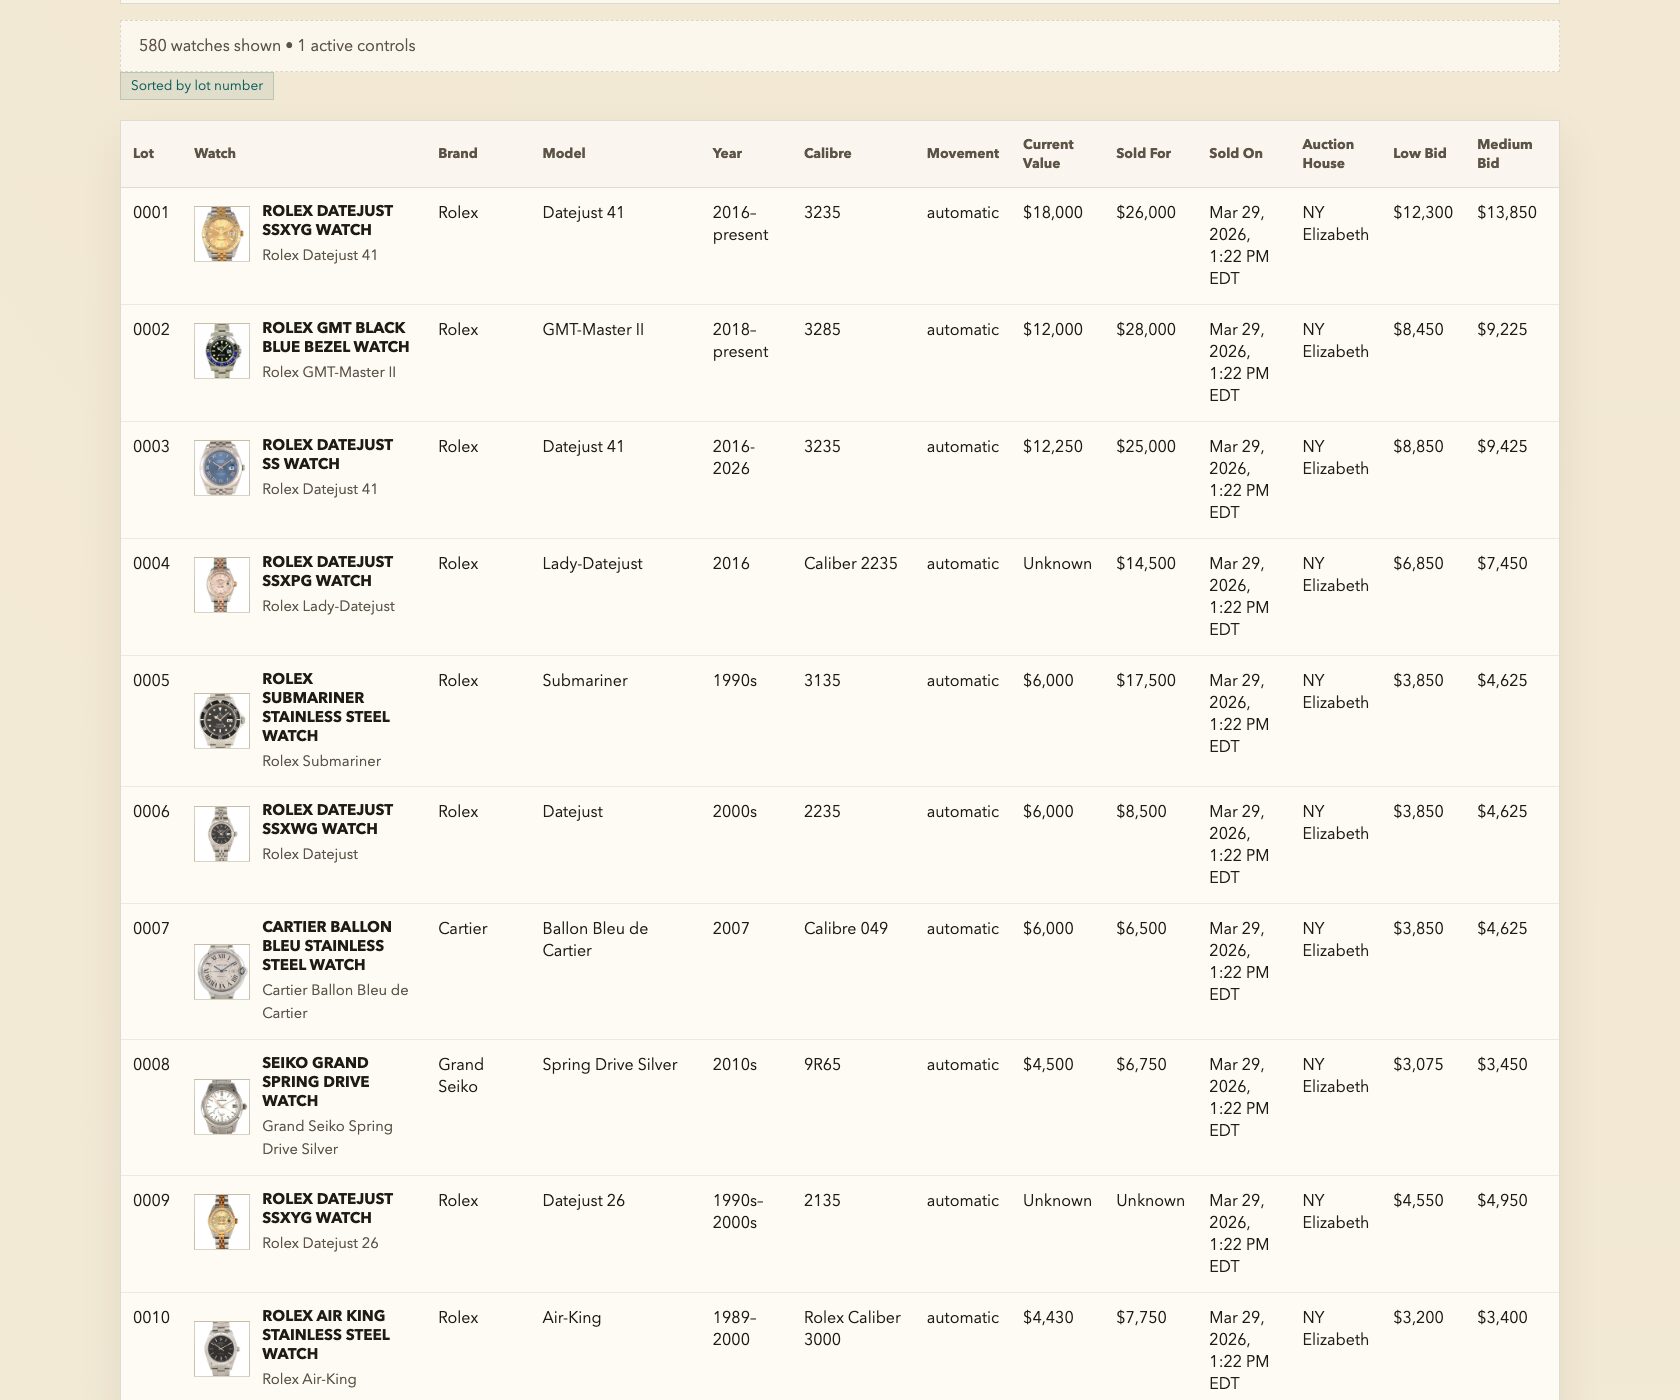
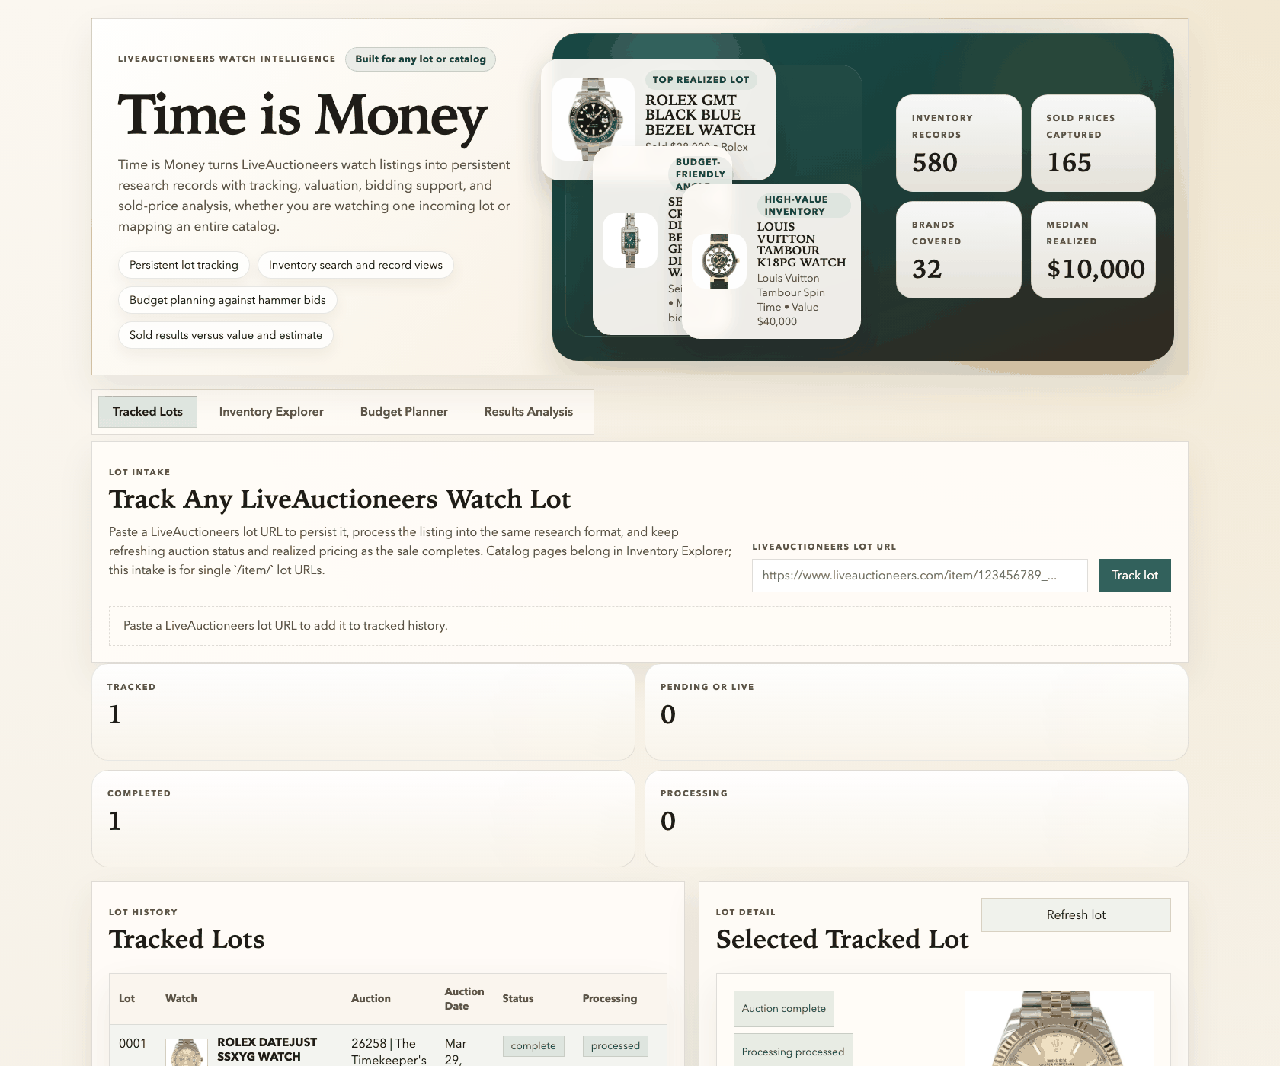
    If you read my last post, you saw the finished product: a full research platform for 580 watches from a single auction catalog. Bid recommendations, market values, budget planning, sold-price analysis. The whole thing built in an afternoon.

    What you didn’t see was the part that actually mattered — the thinking. The bets I placed on myself before I ever typed a prompt. The moments where I had to be surgically specific, and the moments where I could wave my hand and say “you figure it out.” The quiet calculus of do I actually know enough about this to trust what comes back?

    This post is about that part. Not a recipe — more like the conversation I’d have with you at a bar if you asked me “okay, but how did you actually do it?”


    The Four Bets

    Before I typed a single word into Codex, I was making bets. Not consciously — I didn’t sit down and write them on a napkin. But looking back, the entire project hinged on four assumptions I made about myself, the tools, and the world. If any one of them had been wrong, the whole thing would have collapsed.

    Bet #1: The tools are good enough to do this.

    This is the one most people get stuck on. They think: Can AI actually build a working app from a conversation? And the answer, a year ago, was “kind of, but you’d spend more time fixing things than building them.” The answer today is different. I’d been watching the tools evolve: tinkering with Claude and Codex and I had a gut feeling that we’d crossed a threshold. Others online agreed: there was a turning point around November of 2025.

    Bet #2: The information I needed was actually out there.

    Here’s the thing about watches: the secondary market is obsessively documented. Every reference number. Every caliber. Every production year. Sites like Chrono24, Bob’s Watches, EveryWatch — they’ve been cataloging this stuff for years. Phillips and Sotheby’s publish their auction results. Brand enthusiasts run forums with more detail than most academic databases.

    I was betting that an AI with vision capabilities could look at a photo of a watch, cross-reference it against the title and description from the listing, and find the real data: the reference, the caliber, the market value, the historical MSRP. Not because the AI “knows” watches — but because the information exists in enough places online that it could piece it together.

    This bet was that the wisdom of the masses for watches is valuable in aggregate, and not statistically barbelled (lots of bad info counterbalanced with some expert info).

    I knew the watch world was data-rich. If I’d been trying to do this with, say, the correlation of fiscal policy with stock market fluctuations (or some other wonk area I have no business being near), the bet would have been much riskier. The richness of information in your domain is a prerequisite. Know your landscape before you ask an AI to navigate it.

    Bet #3: I know enough about watches to evaluate what comes back.

    This is the sneaky one. The bet that’s easy to overlook and dangerous to get wrong.

    I’m not a watchmaker. I’m not an appraiser. I can’t look at a movement and tell you whether it’s a good one, an accurate one, a certified one or whatnot. But I’ve spent years reading about watches — absorbing the culture, the brands, the price ranges, what’s a stylistic preference vs what’s true horological mastery. I know that a Cartier Tank Française in stainless steel shouldn’t be valued at $15,000 on the secondary market. I know that a quartz Omega is a very different animal from a mechanical one. I know enough to squint at a reverse panda dial and think: that may not appeal to everyone, but I love it.

    That accumulated experience (let’s not conflate it with wisdom in my scenario) — the ability to smell when something is off — is what makes the whole process work.

    The AI does the heavy lifting. You do the quality control. But you can only do quality control if you have some baseline understanding of what quality means, what it unlocks for you and what it doesn’t protect you from.

    In other words, you don’t need to be an expert. You need to be a curious amateur who’s done their homework and understands their risks and blind spots.

    I’ll come back to this one. It matters more than you think.

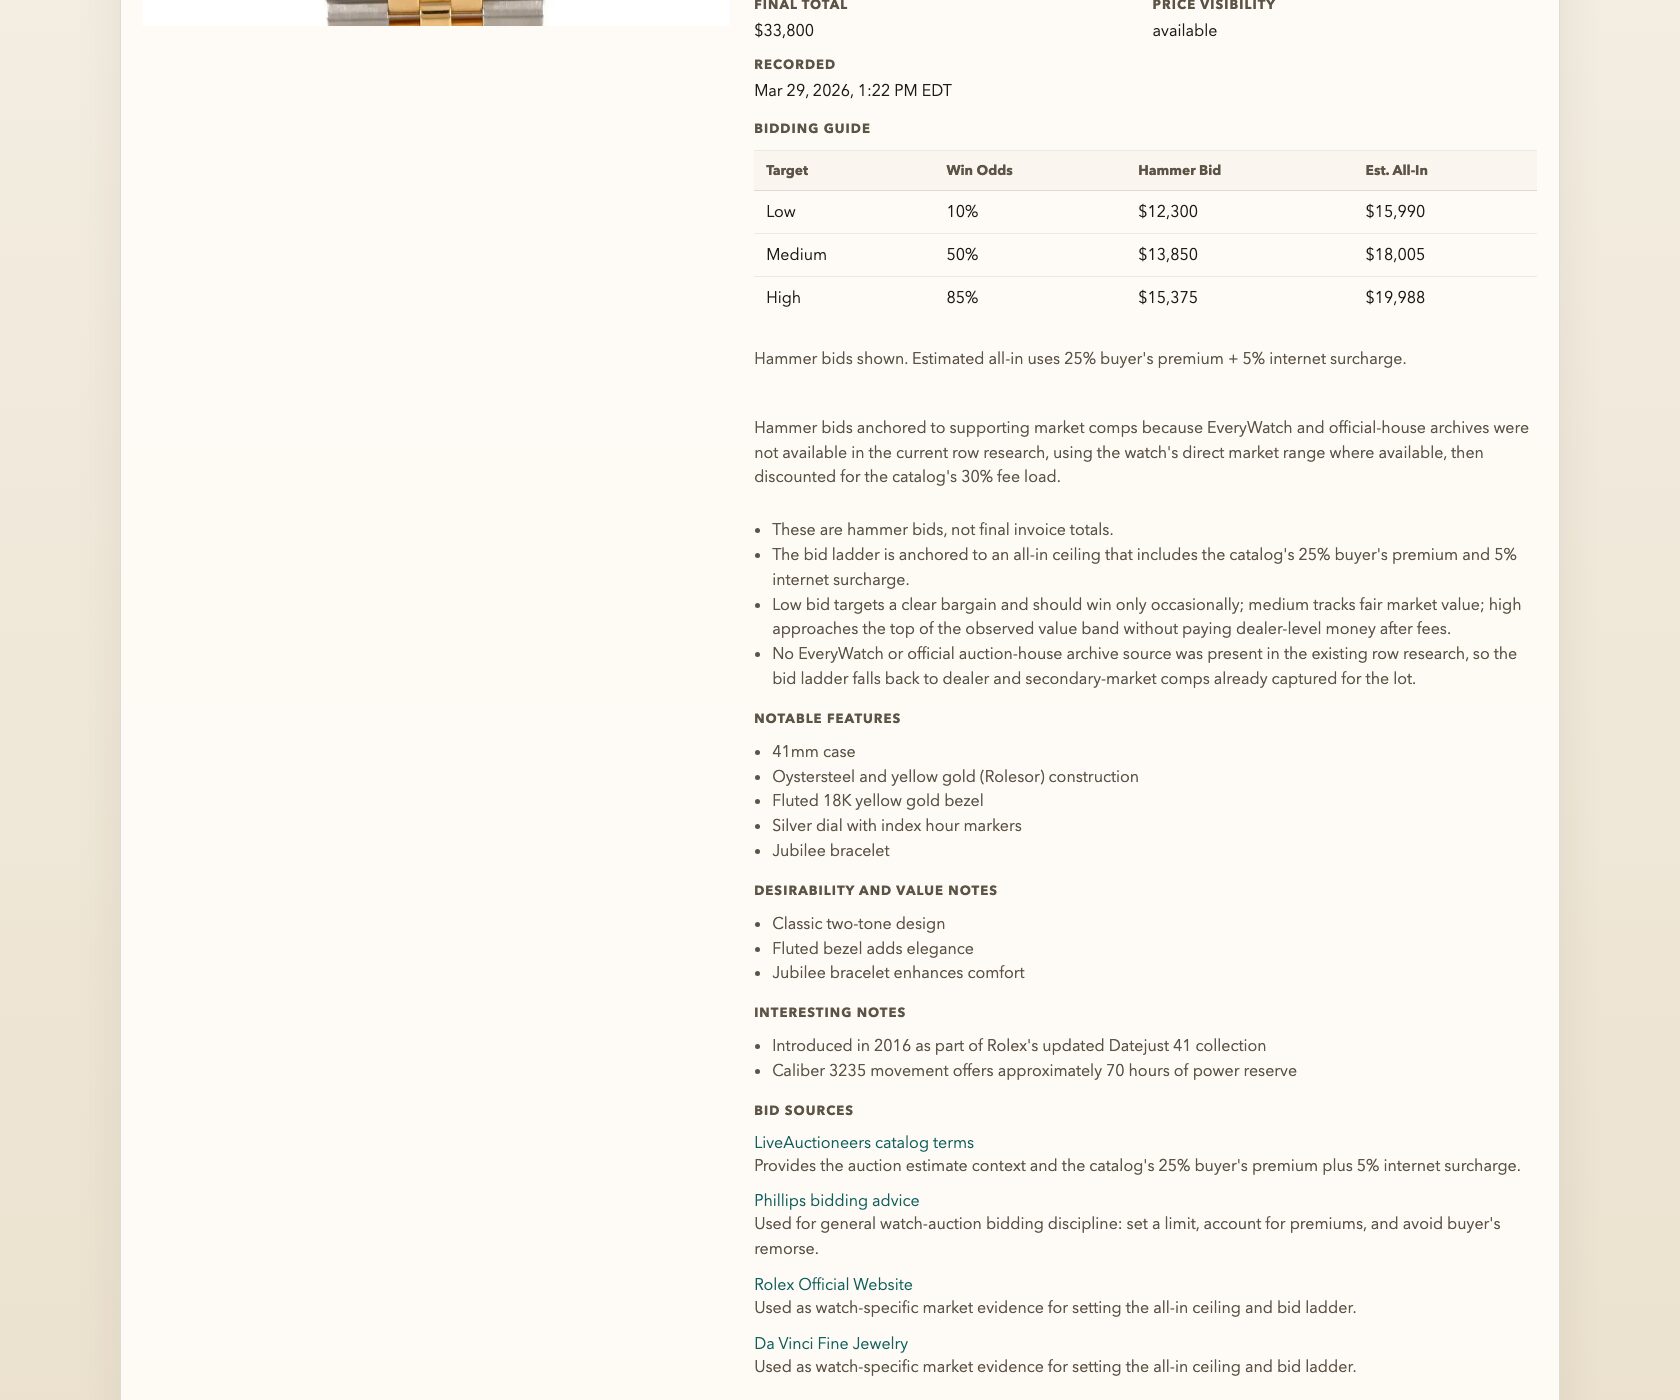
    Bet #4: The bid recommendations would be financially sound.

    This was the scariest bet. Because the other three are intellectual exercises — interesting to think about, low stakes if you’re wrong. But Bet #4 is the one where real money enters the picture. If I was going to use this tool to actually bid on watches, the numbers had to be grounded in reality. Not hallucinated. Not optimistic. Not based on some training data from 2022 that doesn’t reflect the current market.

    I spent the most time here. Questioning the methodology. Challenging specific lots. Asking the AI to show its work. And I’ll walk you through exactly how that went — because this is the part where being specific in your prompts goes from “nice to have” to “this is where your money is.”


    Where I Was Specific (And Where I Wasn’t)

    If there’s one thing I want you to take away from this post, it’s this: knowing when to be precise and when to let go is not just an important skill. It’s the whole ball game.

    It’s not about writing perfect prompts. It’s about knowing which parts of the problem you need to define and which parts you can hand off.

    The Opening Prompt: Specific Where It Mattered

    Here’s the first thing I typed into Codex. This is the real prompt — unedited, exactly as I wrote it:

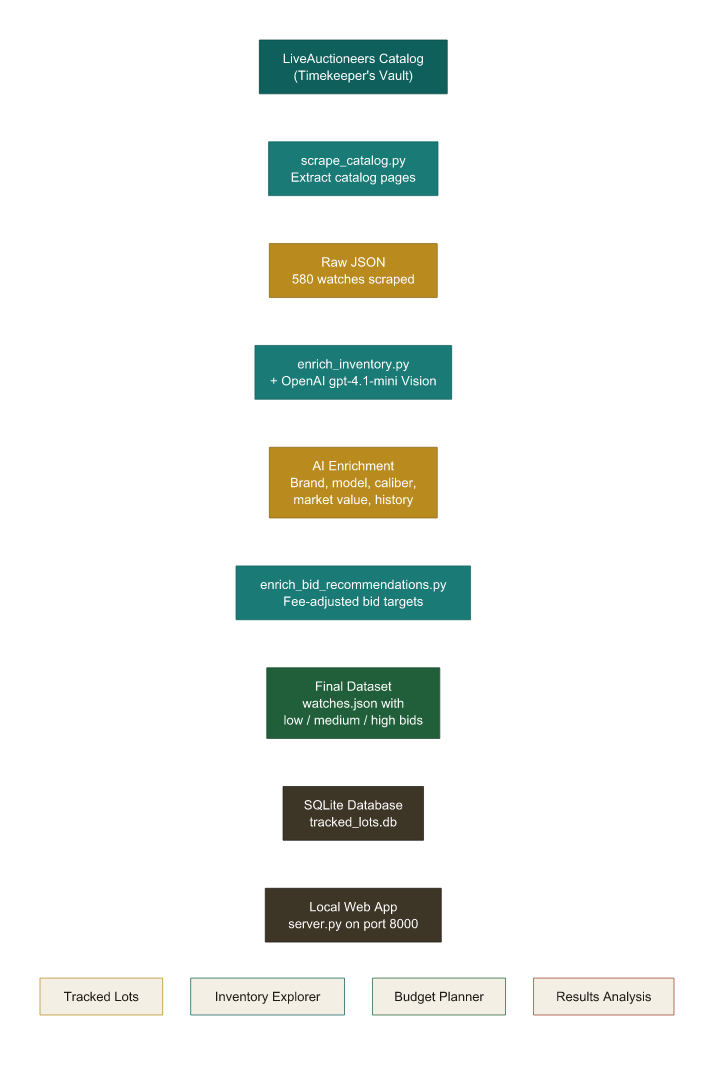
    “I need you to do some tedious research. On this site: [LiveAuctioneers URL] is a series of watches – 580 watches across 24 pages. I need you to compile a full inventory of the following:

    1) an image of each watch
    2) gather information about the watch from its title and then, with the image, find out exactly the make and model and calibre of each watch.
    3) Find the brand of the watch, its model, it’s most likely year of production, its calibre, and if it’s automatic, manual, or quartz
    4) Find any notable features…
    5) Research and find out the approximate cost to purchase it new…
    6) What that purchase cost would be in today’s USD
    7) What the approximate value for the watch is today from sites like Chrono24, Bobs Watches…
    8) any other interesting information…

    Compile this information into a table and then use that table to generate a web app…”

    Look at what I was specific about:

    SPECIFIC: The eight numbered data points. Brand, model, caliber, movement type, production year, original MSRP, inflation-adjusted value, current market value. I knew exactly what information I needed for each watch because I’d been reading about watches for years. This wasn’t the AI’s job to figure out — it was mine. These are the columns in the spreadsheet of my brain.

    SPECIFIC: The sources. “Sites like Chrono24, Bobs Watches.” I named real places where watch values are tracked. I didn’t say “find the value somewhere.” I pointed the AI toward the actual authoritative sources in the watch world. You know the trusted sources in your domain better than any AI does — name them.

    VAGUE (on purpose): “Compile this information into a table and then use that table to generate a web app.” I said nothing about what the web app should look like. No wireframes. No color palette. No layout preferences. I didn’t need to — the important thing was the data structure and the research. The presentation could be figured out later. And it was.

    VAGUE (on purpose): “Any other interesting information.” This is my favorite part. It’s an open door. I’m saying: I trust you to notice things I wouldn’t think to ask about. And it did — surfacing details about specific dial variants, bracelet types, and production quirks that I wouldn’t have known to request.

    Codex worked for about 40 minutes and came back with 580 enriched watch records and a working web app. Forty minutes. That’s less time than I’ve spent reading a single watch forum thread about whether the Rolex Explorer should have a 36mm or 39mm case. Hey, a guy can dream.

    The Enhance Prompts: Trusting the Details

    Once I had the base, I started layering. Each prompt added one thing:

    Prompt 2: “This is awesome! Now, let’s enhance: For each watch, add in fields for ‘recommended low bid’, ‘recommended medium bid’, and ‘recommended high bid’…”

    SPECIFIC: Three tiers. Low, medium, high. I didn’t say “add bid recommendations” and leave it open-ended. I defined the structure: three distinct tiers, each serving a different purpose. This matters because it forced the AI to think about bidding as a spectrum of risk, not a single number.

    Prompt 3: “excellent. next improvement. for the grid and list view, introduce the ability to sort and filter. use your best judgement for what would be good filters, a good user experience, and good UI.”

    VAGUE (on purpose): “Use your best judgement.” I didn’t specify which filters. I didn’t pick the sort fields. I didn’t design the UI. Three minutes and 44 seconds later, I had full sorting and filtering that was better than what I would have spec’d out myself. Sometimes the best prompt is permission.

    See the pattern? Be specific about what you know. Be vague about what you don’t. If you have strong opinions about the data you need, spell them out. If you don’t have strong opinions about how a dropdown menu should work, don’t pretend you do. The AI is better at UI details than you are. Let it cook.


    The Gut Check (Or: That Time I Called the AI’s Bluff)

    Remember Bet #3 — the one about knowing enough to evaluate what comes back? This is where it got tested.

    The bid recommendations came through. 580 watches, three tiers each. Impressive. Except… some of the numbers felt off. I couldn’t articulate exactly why at first — it was that watch-nerd spidey sense tingling. So I started asking questions.

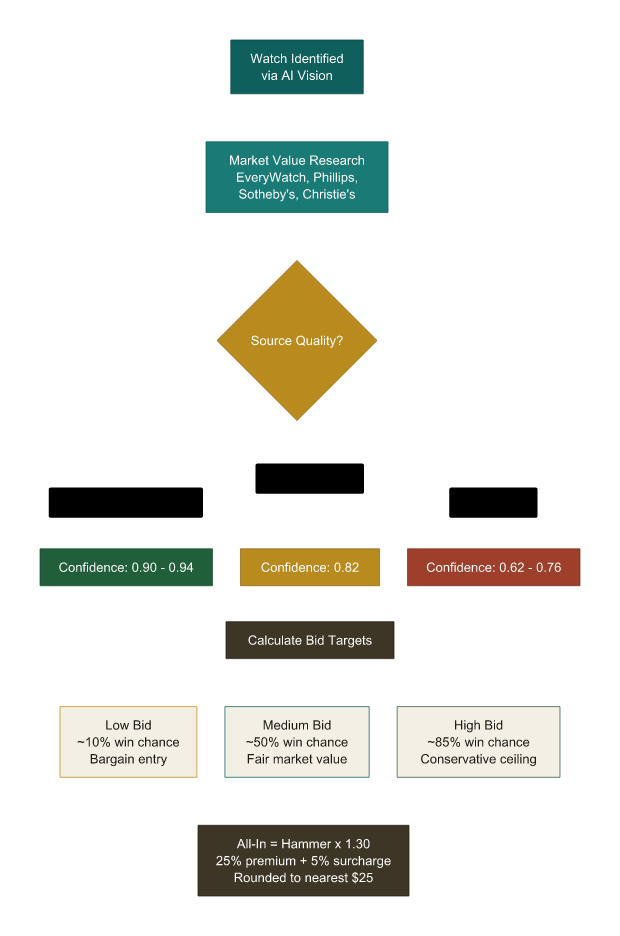
    “what is your methodology for the recommended low bid, recommended medium bid, and recommended high bid? how are you determining those numbers? what research are you doing and using?”

    “the bid estimations (low, medium, high) still seem on the lower end to me. explain to me why they are accurate or how we can improve their accuracy. For example: Lot 0152, CARTIER TANK FRANCAISE SS WATCH, shows an estimate range of $10,650 to $15,620 and a current value of around 3300. Do you believe the estimates you have provided are accurate?”

    I love this moment. Because the AI agreed with me. It said, essentially: “You’re right, the estimate range was based on original retail pricing and doesn’t reflect the current secondary market. Here’s how we should fix the methodology.” It adjusted. The numbers got better. And I learned something about watch valuation in the process.

    This is Bet #3 in action. I didn’t need to be a certified appraiser. I just needed to know that a stainless steel Cartier Tank Française doesn’t sell for $15,000 on the secondary market. That one piece of domain knowledge — a feeling, really, built up from years of casually browsing listings I couldn’t afford — was enough to catch an error that would have thrown off every bid recommendation in the catalog.

    Your domain knowledge is the filter. The AI generates. You validate. And you only need to be right enough, often enough, to keep the whole thing honest.


    When Things Broke (Because Of Course They Did)

    Let me dispel any illusion that this was a smooth, cinematic montage of me typing brilliant prompts and getting perfect results. Things broke. Multiple times. In ways that, if I’m being honest, made me briefly question whether I should have just used a spreadsheet like a normal person who is avoiding reality with “hobbies”.

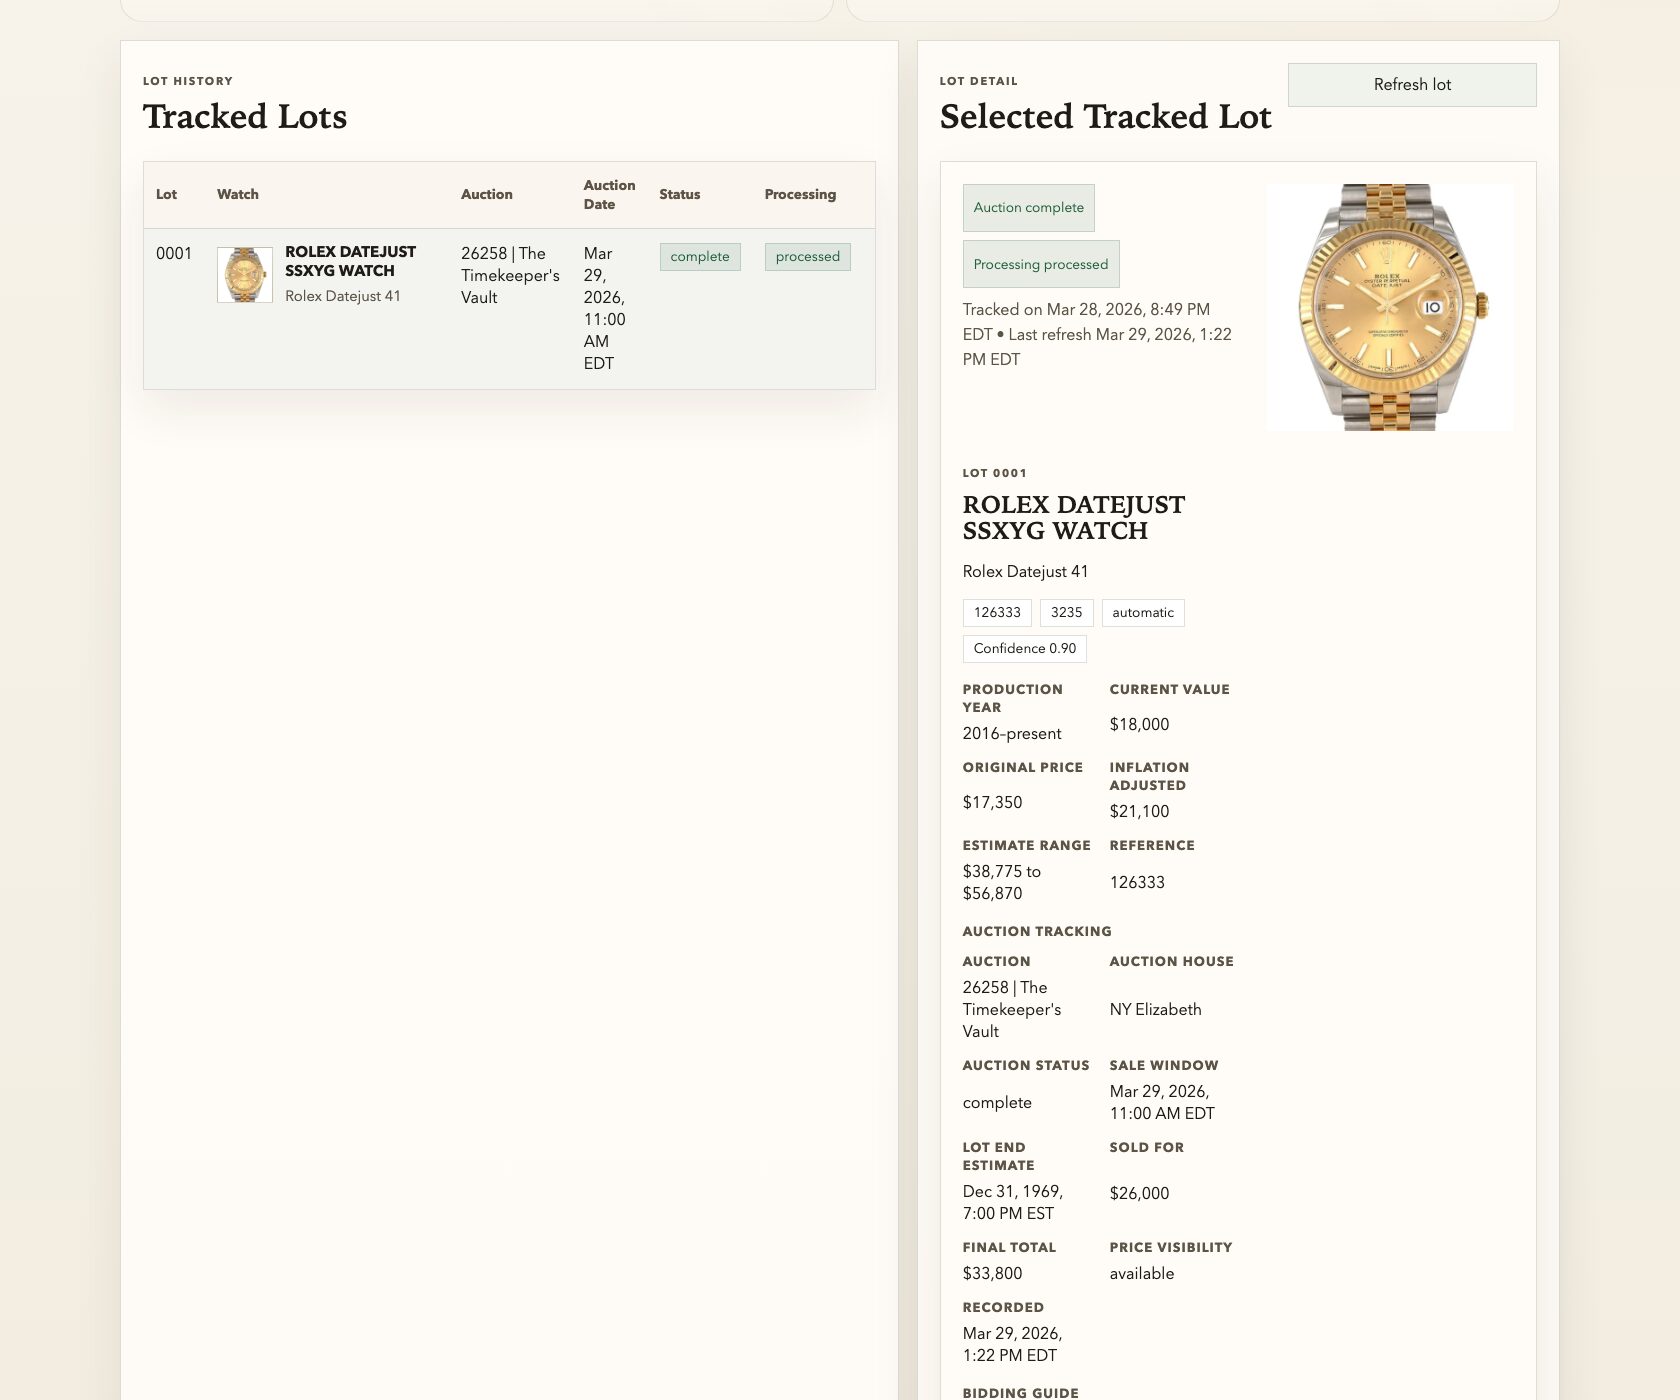
    “im getting a lot of errors when i paste in [URL] to the Track Lot section, and i dont see the previous data we compiled for that lot.”

    That was it. No stack traces. No log files. No eloquent description of the error state. Just: “this thing is broken and I am mildly annoyed.” Five minutes later, two bugs found and fixed. Feature working. Crisis averted.

    Your only job when something breaks is to describe what you expected and what actually happened. You don’t need to know why. You wouldn’t open the hood of your car and start poking around — you’d tell the mechanic “it makes a grinding noise when I turn left.” Same energy.


    The Live Auction (Or: When the App Became Real)

    The auction happened yesterday, March 29th, 2026. The Timekeeper’s Vault. 580 watches going under the gavel.

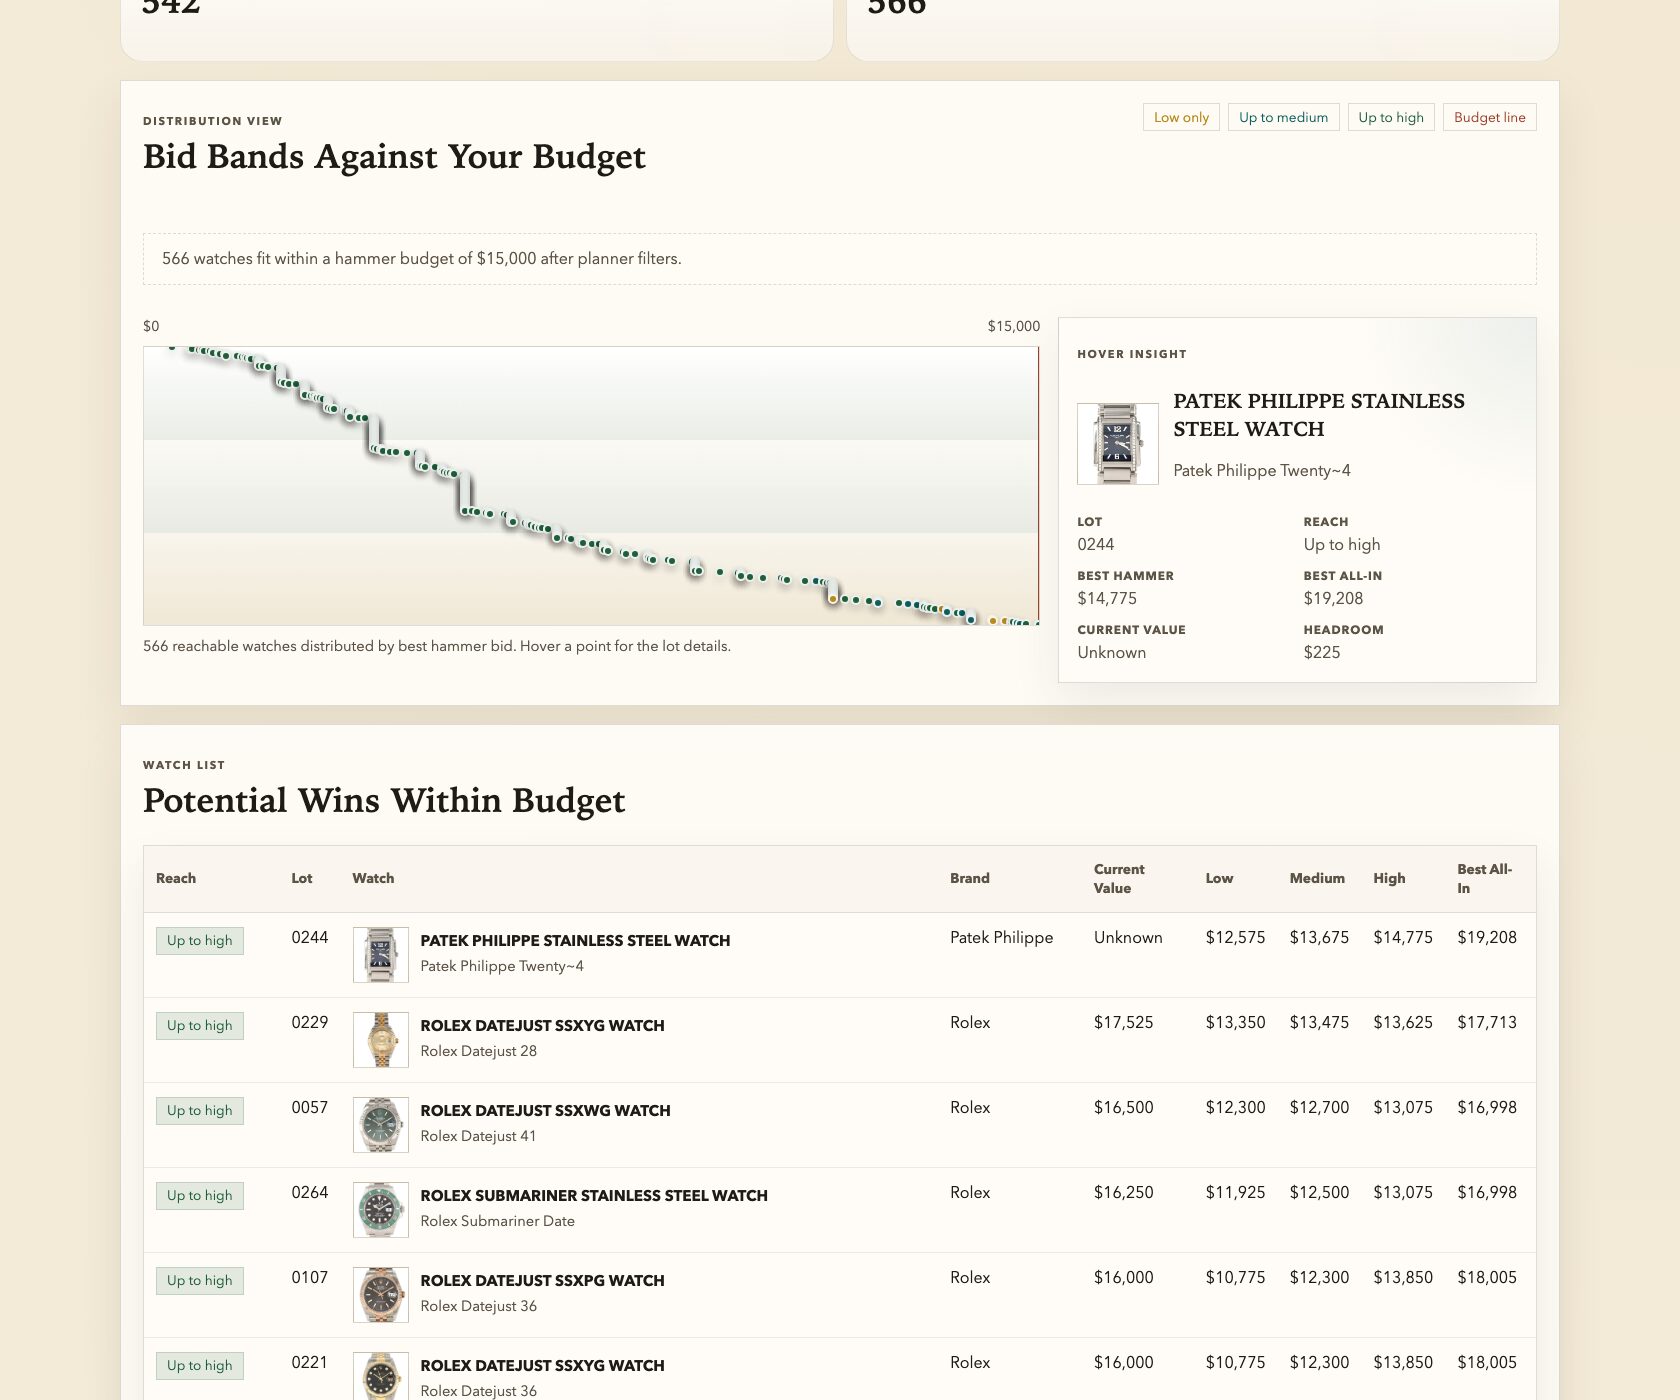
    And here’s where the whole project stopped being an interesting exercise and started being a genuinely useful tool. Because as lots started selling, I realized: I have all these estimates. I have all these bid recommendations. And now I have actual sold prices. What if I could see them side by side?

    “yes, the auction is going on now… you can now see a ‘Sold For’ price for lot items. Update the site to show the sold for price with today’s date, amount sold for, and auction house that sold it?”

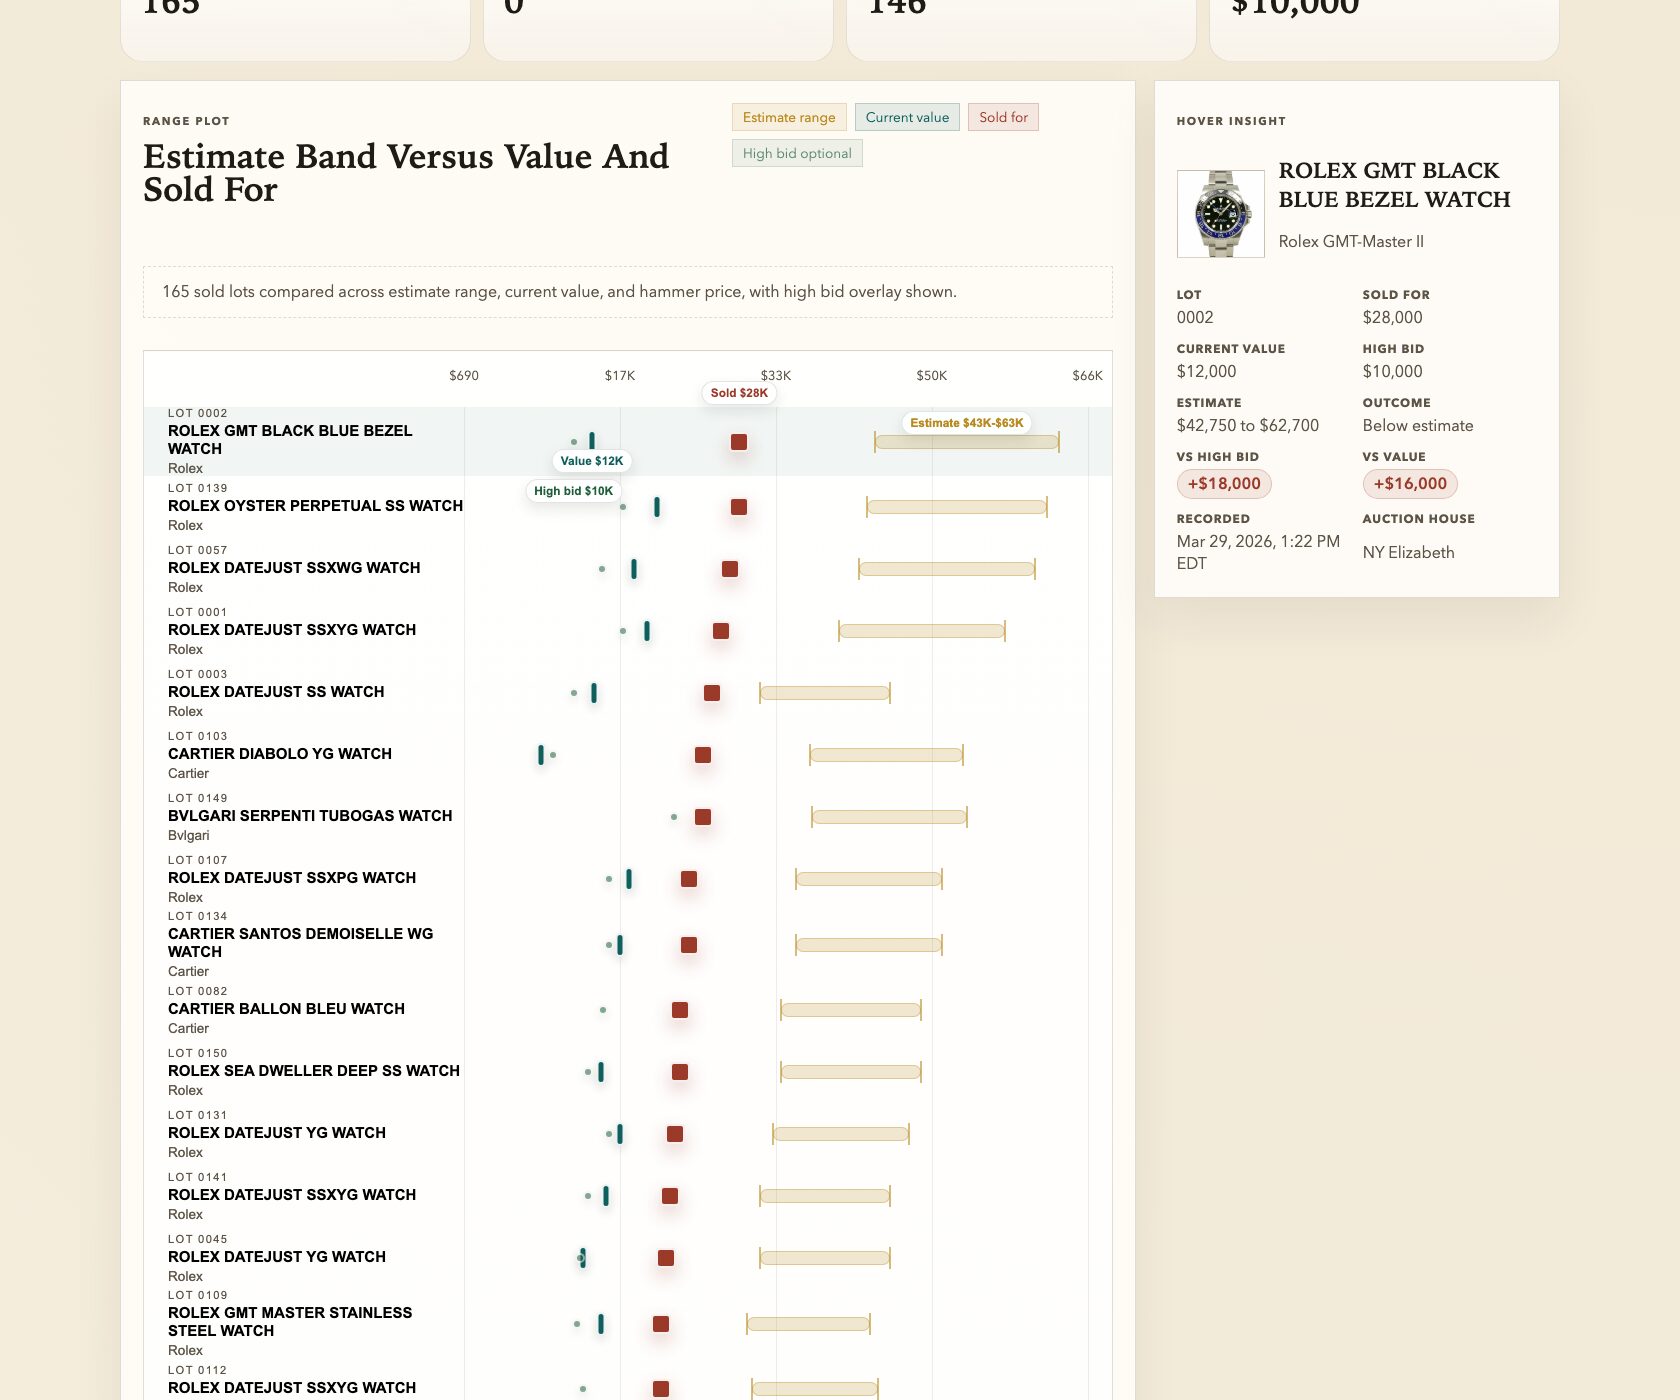
    “create a new visualization that shows the variance between each individual watches value, the high bid you recommended, the estimate range, and the sold for…”

    These features weren’t in the plan. They couldn’t have been — I didn’t know I’d want them until I was sitting there watching lots close in real time and feeling that itch of wait, I have all the data, why can’t I see this comparison?

    The results were eye-opening: 220 out of 243 sold lots went above the high estimate. Ninety percent. I wouldn’t have known that without the variance visualization. And I wouldn’t have had any of it without that first prompt about 580 watches I was too curious to ignore.

    And the whole experience was incredible. Watching the live bids, side by side with my tiny app, life altering money flying by in seconds for gorgeous masterpieces of horology. I refreshed LiveAuctioneers constantly. I watched my app show fun facts and details about each lot as it passed. It ingested hammer prices. My heart raced on the three bids I placed so frantically that I went for a run to settle myself.

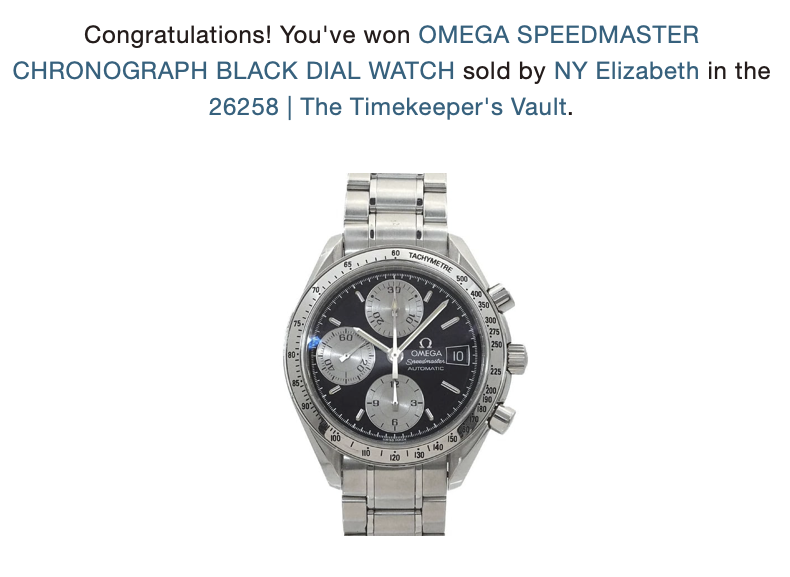
    I surged with pride and astonishment watching my app side by side with the live results. I won a freaking watch with my own hands and work and knowledge! (I totally overpaid, but what a story!)


    Recap: What This Actually Takes

    1. Curiosity about a specific thing. I didn’t set out to “build an AI app.” I set out to understand 580 watches in an auction catalog. The app was a side effect of the curiosity. If you don’t care about the underlying problem, the whole process will feel like work. If you do care, it feels like play.

    2. Enough domain knowledge to ask the right questions — and catch the wrong answers. You don’t need to be an expert. But you need to be the person who’s been lurking in the forums, reading the articles, absorbing the culture of whatever it is you’re interested in. That background knowledge is what turns you from a passive consumer of AI output into an active collaborator.

    3. The willingness to say “I don’t really know what I’m doing, but let’s find out.” I made four bets, and they all paid off — but they were real bets. There was a version of this afternoon where the data was bad, the numbers were wrong, and I’d have wasted a few hours. I was okay with that. Because the downside was a lost afternoon, and the upside was exactly what I got.


    The Honest Truth About Specificity

    Be specific about what you know deeply. I know watches. I spelled out eight numbered data points and named real sources. That specificity made the first prompt effective.

    Be vague about what you don’t know. I said “use your best judgment” for the UI. Three minutes later I had something better than I would have designed.

    Be specific again when the stakes are high. When real money was involved, I challenged individual lots and asked for methodology. The specificity matched the stakes.

    Think of it like this: if you were hiring someone to renovate your kitchen, you’d be very specific about the countertop material and the cabinet layout (because you cook there), reasonably vague about the electrical routing (because you trust the electrician), and very specific again about the budget (because it’s your money). Same principle. Different scenario.


    Your Turn (For Real)

    I’m not going to give you a fill-in-the-blank template. If this post has done its job, you don’t need one. You need your version of The Timekeeper’s Vault — that thing you’re obsessed with, that collection or dataset or question that nags at you.

    Whatever it is, here are the bets you’re making:

    1. The tools can handle it. (They almost certainly can.)
    2. The information is out there. (Is your domain data-rich?)
    3. You know enough to evaluate the output. (Can you smell when something’s off?)
    4. The stakes are manageable. (Start where the downside is a lost afternoon, not a lost fortune.)

    If all four check out? Describe your problem in plain English. Be specific about the data you want. Be vague about the stuff you don’t care about. Ask it to show its work. Push back when something feels wrong.

    You’ll be surprised how far one afternoon can take you.


    The Prompt Cheat Sheet

    MomentWhat I DidWhy It Worked
    The OpeningListed exactly what data I wanted, numbered, with named sourcesSpecificity on the data points I knew mattered. Vague on everything else.
    The Enhance“This is awesome! Now add [one thing]”Builds on momentum. One layer at a time.
    The Delegation“Use your best judgment for the UI”Let the AI handle what it’s good at.
    The Gut Check“Explain your methodology” + challenged a specific lotDomain knowledge as quality control.
    The Bug Report“This thing is broken, here’s what I tried”Describe symptoms, not causes.
    The Evolution“The auction is live — now show me sold prices vs. estimates”New features from actual usage.

    Built with curiosity, four bets, and an alarming amount of watch forum knowledge that I can finally justify.

  • Time is Money: How I Built a Watch Auction Research Platform in a Few Hours

    Time is Money: How I Built a Watch Auction Research Platform in a Few Hours

    I have a confession: I’m a watch person. Not in the “I own a Patek Philippe” sense — more in the “I will spend forty-five minutes reading about the history of the Omega Speedmaster’s hesalite crystal” sense. I love everything about fine watches. The prestige. The legacy. The intricacy. The fact that these are mechanical marvels that humans have been refining for hundreds of years. The craftsmanship, the attention to detail, the complications — there is something deeply satisfying about an object that exists at the intersection of engineering and art.

    I’ve just never been able to afford the really expensive ones.

    But I’ve reached a point where I’m seriously considering dipping my toe in. Finding a good used watch online. Making a conservative bid. Learning the game.

    And that’s where this whole project started.


    The Spark

    I came across LiveAuctioneers while doing what I always do — browsing watches I can’t justify buying (a whole post in and of itself). One catalog in particular caught my eye: The Timekeeper’s Vault. 580 watches. Rolex, Omega, Cartier, Chanel, Breitling, Tudor, Grand Seiko — a curated collection put together by someone who knows their stuff.

    The problem? The lot descriptions on LiveAuctioneers are… lacking. A title, an estimate range, maybe a sentence or two. But I know there are subtleties to every watch: the calibers, the complications, the finishes, the styling, the bracelets, the reference numbers that make one watch worth twice as much as another. But, I don’t know enough to know what to look for.

    I needed something that could look at these lots and tell me: What am I looking at? When was it made? Why is it special? What has it historically sold for? And what should I realistically bid? Is it just shiny, or a diamond in the rough?

    So I built it.

    Time is Money landing page with featured watches, live metrics, and navigation
    The Time is Money landing page. 580 watches. 32 brands. One very curious person behind the keyboard.

    What Time is Money Does

    Time is Money is a local web app that transforms LiveAuctioneers watch listings into persistent, enriched research records. It has four modes, each one built because I needed to answer a specific question.

    1. Tracked Lots — “What am I watching right now?”

    Paste any LiveAuctioneers lot URL. The app scrapes it, parses the auction metadata, and starts tracking it in a local SQLite database. It keeps refreshing — bid counts, leading bids, hammer prices — recording point-in-time snapshots so you can see the bid history unfold.

    This was the first of many iterations, and with Codex, it was done in under 15 minutes. Absolutely wild.

    2. Inventory Explorer — “What’s actually in this catalog?”

    This is where it gets fun. All 580 watches from The Timekeeper’s Vault, searchable and filterable, in three views:

    Inventory Explorer grid view showing watch cards with images, brands, and values
    Grid view. Each card shows the watch image, brand, model, and current market value. 580 watches at a glance.
    Inventory Explorer list view with calibers, movements, and bid recommendations
    List view. Caliber, movement type, bid recommendations, confidence scores — the dense, analytical view for when you want to compare across the catalog.
    Inventory record detail view deep diving into a single watch
    Detail view. Everything the AI research found: brand, model, reference, production year, notable features, historical MSRP, current market value, and recommended bids at three tiers.

    Every watch has been enriched with AI-powered research. But more on that in a moment.

    3. Budget Planner — “What can I actually afford?”

    This is the mode that made me grin. You enter a hammer-bid budget, and the app instantly shows you every watch in the catalog that’s realistically within reach — broken down by bid tier:

    • Low bid (~10% win probability) — the bargain entry
    • Medium bid (~50% win probability) — fair market value
    • High bid (~85% win probability) — conservative ceiling
    Budget Planner scatter chart showing reachable watches at a $5,000 budget
    Budget Planner at $5,000. The scatter chart shows every reachable watch, color-coded by bid tier. Gold for low, teal for medium, green for high. The blue line is your budget ceiling.

    The app even calculates your “headroom” — how much room you have between your budget and the all-in cost (hammer + 25% buyer’s premium + 5% internet surcharge). It’s the kind of thing that makes you feel like you actually have a strategy instead of just vibing in an auction room.

    4. Results Analysis — “How did reality compare to the estimates?”

    As the auction proceeded (today, March 29th, 2026), results started coming in. I wanted to see the discrepancies — what I estimated vs. what actually happened vs. what the auction house predicted.

    Results Analysis comparing sold prices against estimate ranges and market values
    Results Analysis. 243 sold lots plotted on a shared scale: estimate range, current market value, and realized hammer price. The high-bid overlay shows where the top competing bid landed. 220 watches sold above the high bid estimate.

    This page is where the whole thing comes together. You can see patterns: which brands consistently beat their estimates, which watches were sleeper deals, where the market diverges from the catalog’s estimate.


    The Walkthrough

    Here’s the full app in action:

    Full walkthrough of Time is Money across all four modes
    A full walkthrough: navigating between Tracked Lots, Inventory Explorer, Budget Planner, and Results Analysis.

    How It Works Under the Hood

    The architecture is straightforward but the pipeline is where the magic happens.

    The Data Pipeline

    Data pipeline diagram from LiveAuctioneers catalog through AI enrichment to the local web app
    The full pipeline: scrape the catalog, enrich with AI vision, calculate fee-adjusted bid recommendations, persist to SQLite, serve locally.

    Stage 1: Scrape the catalog. A Python script (scrape_catalog.py) fetches every page of The Timekeeper’s Vault catalog from LiveAuctioneers, extracting the embedded JSON data. 580 watches, images, estimates, descriptions — all pulled into a raw JSON file.

    Stage 2: AI enrichment. This is the good part. Each watch gets sent to OpenAI’s gpt-4.1-mini with vision capabilities. The model looks at the watch photos and the listing text and identifies:

    • The exact brand, model, and reference number
    • The caliber and movement type (automatic, quartz, manual)
    • Production year range
    • Notable features (case materials, complications, dial variants)
    • Historical MSRP and inflation-adjusted value
    • Current market value range (low / mid / high)
    • Desirability notes and historical context
    • Source citations from EveryWatch, Phillips, Sotheby’s, Christie’s, and brand pages

    Stage 3: Bid recommendations. A separate script calculates three fee-adjusted hammer-bid targets for every watch, accounting for the 25% buyer’s premium and 5% internet surcharge that LiveAuctioneers charges. Every bid is rounded to the nearest $25 (auction convention).

    The Bid Logic

    Bid calculation flowchart from AI identification through source quality to three-tier bid targets
    How bid recommendations are calculated. Source quality determines confidence. Three tiers cover different risk appetites. All bids are fee-adjusted so you know your true all-in cost.

    The confidence score is something I’m particularly proud of. Not all research is created equal:

    Source QualityConfidence
    EveryWatch + official auction archives0.90 – 0.94
    EveryWatch or auction archives alone0.72 – 0.90
    General market comparables0.82
    Estimate proxy (no direct comps)0.62 – 0.76

    When you’re looking at a bid recommendation, you can see whether it’s backed by strong comparable sales data or whether it’s an educated estimate. That transparency matters when real money is on the line.

    The Tech Stack

    The whole thing runs locally on my machine. No cloud. No deployment. Just:

    • Python backend with a threaded HTTP server and SQLite
    • Vanilla JavaScript frontend — no React, no frameworks, just clean DOM manipulation
    • OpenAI API for the research enrichment pipeline
    • Custom CSS with a warm, minimal design system (cream backgrounds, serif headlines, gold/teal/green accent palette)

    The design was intentional. I wanted it to feel like a well-made watch catalog itself — warm paper tones, clean typography, structured layouts. Not a dashboard. A reference.


    What I Learned (And What Surprised Me)

    The auction results were eye-opening

    Of the 243 lots that sold, 220 went above the high estimate. That’s 90%. The Timekeeper’s Vault was clearly underestimated by the auction house, or the demand was much higher than expected. Median realized price was $11,500.

    AI vision is remarkably good at watch identification

    I was skeptical. But the model consistently identified reference numbers, calibers, and even specific dial variants from photos alone. It would note things like “luminous hour markers suggest post-2010 production” or identify a specific bracelet type. It’s not perfect — confidence varies — but it gave me a research head-start that would have taken weeks to compile manually.

    Fee math is non-trivial and important

    The 30% fee load (25% buyer’s premium + 5% internet surcharge) on top of the hammer price is significant. A $5,000 hammer bid becomes $6,500 all-in. The Budget Planner accounts for this, and seeing the gap between “what you bid” and “what you pay” in concrete numbers changed how I thought about my budget.

    You don’t need much to build something genuinely useful

    The total effort? A few hours. Maybe four or five hours of actual focused work across a couple of sessions. The whole app — scraping, AI enrichment, bid logic, four full UI pages with visualizations, SQLite persistence, auto-refresh, deep linking — in less than a day.

    That’s not a flex. That’s the point.


    Why I’m Sharing This

    I built Time is Money for myself. It runs on my laptop. It’s not deployed anywhere. It’s a tool I made because I was curious and because I wanted to understand what I was looking at before I even thought about bidding.

    But I’m sharing it because I think the process matters more than the product.

    A year ago, building something like this would have taken me weeks — assuming I even had the full skillset to pull it off. The scraping, the AI pipeline, the bid calculations, the frontend visualizations, the database layer, the auto-refresh polling. That’s a lot of different domains.

    Today, with tools like Codex and Claude, I could think through what I wanted, describe the layout, iterate on the logic, and have a fully working research platform in an afternoon. Not a prototype. Not a mockup. A real, functional tool with 580 enriched watch records, three-tier bid recommendations, live auction tracking, and sold-price analysis.

    If you can clearly articulate what you want to accomplish and how you want it laid out, you can build something genuinely cool for yourself. That capability is at your fingertips right now. You don’t need to be a full-stack developer. You don’t need to know every framework. You need curiosity, clarity of thought, and the willingness to iterate.

    I’m super proud of this one. It’s a small project in the grand scheme of things, but it’s mine. I built it because I love watches, I wanted to learn, and I wanted a better way to understand what’s out there.

    Time is money. And this was time very well spent.


    Quick Stats

    MetricValue
    Watches in catalog580
    Unique brands32
    Lines of code~6,800
    AI-enriched records580 / 580 (100%)
    Bid recommendations580 / 580 (100%)
    Most common brandRolex (206 lots, 35.5%)
    Median market value$6,000
    Median realized price$11,500
    Sold above high estimate220 / 243 (90.5%)
    Build time~4-5 hours of focused work
    Frameworks usedZero. Vanilla JS, Python stdlib, SQLite.

    Built with curiosity, Claude, and a deep appreciation for things that tick.


    PS — Update as of 4pm on 03.29.2026: I won an Omega Vintage 1990s Speedmaster Date 3513.51!

    Guess the app worked a little too well 😊

  • Because I Was Tired of Playing Human Price-Comparison Engine..

    Because I Was Tired of Playing Human Price-Comparison Engine..

    A small tool, a very ordinary problem, and one of the clearest examples I’ve found of why Codex is useful for much more than coding.

    Most weeks, grocery shopping does not fail in some dramatic way. It just leaks time.

    I shop at a rotating cast of places depending on what we need and what kind of errand day it is: Meijer, Target, Market District, Costco, CVS, and whatever else makes sense that week. That sounds normal because it is normal. The annoying part is that every trip comes with the same low-level decision tax: where should I actually buy this stuff?

    So I do what most people do. I check one app, then another. I search for items. Multiple times, multiple ways.

    I raid the pantry and the fridge for information.

    I eat things. 

    I try to remember which store usually had the better price on yogurt, strawberries, butter, bread, or whatever else is on the list.

    I spend way too much time on a task that happens every week and should be simpler than it is: the constant tiny act of recomputing where to buy the same kinds of things over and over again.

    At some point I got tired of being the human middleware between my grocery list and five different stores.

    I have Codex. It promises to replace me.

    I decided to call the bluff. So I built a grocery tracker.

    The rule was simple: no new system

    I did not want to create a whole new habit just to solve this problem.

    That mattered more than the app itself.

    I already keep my grocery list in Things. Whatever solution I concoct had to respect that. Things is useful, it’s light, I’m molded to it and bonded through repetition like that stain on your favorite chair from wiping your fingers after eating chips far too many times. 

    So the objective was simple:

    I add grocery items to Things, the same way I normally do. Then I run an app to get a breakdown of where I should buy the items on my list.

    Codex cranked it out in a day. Things CLI, API research, browser tools, design considerations, Javascript libraries, more. I clicked “Approve” and “Yes, don’t ask again” all too slowly like the expendable carbon sack I am promised to become. 

    And it worked. It even added some fancy visuals:


    The site pulls the items from my master grocery list, compares the prices, and gives me a much faster sense of what should come from where.

    Right now it only compares Meijer and Target. It’s the first iteration and I kept it limited. Those are two of the places I shop regularly, and they were enough to make the tool useful immediately. 

    It is also not perfect. Product matching is messy in practice. Stores describe things differently. Sizes vary. Search results are not always clean. “Texas Toast” is a perfect example of the kind of item that exposes the edges of the system. Human beings can tell when two results are “basically the same thing” or when they are slightly off. 

    But even with those rough edges, the tool is already worth it.

    The funny part is how small the problem is

    It’s not a startup idea or a sweeping productivity framework.

    It’s definitely not one of those projects where you dramatically reinvent a category and then explain why everyone else has been thinking about groceries wrong.

    It is a very ordinary household problem. And it speaks volumes. 

    A lot of the most useful software in a person’s life should probably be small, specific, and a little idiosyncratic. It should know something about your routine. It should remove friction from your week. It should earn its place by being helpful, not by pretending to be a platform.

    That is exactly the kind of thing Codex is unexpectedly good at enabling.

    People tend to talk about tools like Codex as coding accelerators, which is true but incomplete. The more interesting thing is that they lower the cost of building answers to narrow real-life annoyances. They make it much more reasonable to look at a problem that used to sit in the category of “annoying, but not worth building software for” and say: actually, maybe it is.

    Now the overhead is lower, which means the range of solvable problems gets wider.

    And not just work problems. Life problems.

    Personal problems.

    The kind of thing that lives in the background of your week and drains energy in small, unglamorous ways.

    What I actually like about using it

    The obvious benefit is money.

    If the same list is cheaper at one store, or if certain items are clearly better bought at one place than another, I want to know that. Grocery prices are too inconsistent to leave that entirely to memory.

    But the bigger benefit for me is time and mental relief. It cost me barely anything to make the app. Heck, it was actually pretty fun. 

    I even made a promo ad for it.

    That still makes me laugh a little, because the underlying subject is so unglamorous. It is literally grocery optimization. But that is part of what I find compelling about this whole experience: Codex does not just help with the code. It helps make the idea real. It helps close the loop between problem, solution, interface, and presentation.

    So instead of this project ending as “a script I run for myself,” it turned into something I could actually show.

    Promo ad:

    Product comparison view from Grocery Comparison Tool

    The bigger point

    Codex helped me build specific answers to real life much faster than I ever could.

    My grocery comparison tool is narrow. It’s literally local. It’s wildly imperfect and hardly a novel idea.

    And yet it is one of the most useful things I have built in a while.

    I add items to Things. I run the site. It’s easy.

    I get my answer faster. I make fewer unnecessary decisions. And grocery shopping becomes a little less annoying.

    Still expensive as hell. But less annoying.

    It’s nothing revolutionary. It’s barely more than a geeky side-quest.

    But that is exactly why it matters.

    Because it solves a problem I actually have, in a way that fits how I already live and it’s bespoke to me.

    I think there is a lot of life in that category.

    And I suspect I, and many others are going to keep building there.

  • Book Lover got love!

    Book Lover got love!

    My goal this year has been about exposure: showcasing more of the work I’ve been doing on my own to a public audience.

    And I’ve been doing it. I have this blog up. I publish every week (it’s only been 6 weeks, but hey, it’s infinitely more than zero). I even demo’d a build to my boss on a 1:1 meeting.

    Today, I showcased a desktop app I’ve been building called Book Lover. I am a reader. I read words, I read fast, I read good-ish. I love books. My parents like to say I was half-raised by schools, and another half by libraries, and honestly that explains quite a few things about me. Anywhere I go I have a book. It used to be a physical book in the days before iPads and Kindles. And during my globe-trotting days it was on a larger screen iPhone of some sort. Nowadays it’s a mix of both and my personal library is a barely contained chaos of paper and ink.

    Needless to say, buying, borrowing, and organizing books is a life-long habit. The number of books I want to read, come across as recommendations to read, and daydream about reading numbers in the hundreds, if not thousands. If I were to win the lottery, I’d travel the world to find unique places to sit and read like a ridiculous Green Eggs & Ham for an introverted middle-aged ma.

    “I WOULD, DEFINITELY WOULD IN A TREE.
    IN A CAR! LEAVE ME BE to read.
    I WOULD READ THEM IN A BOX.
    I WOULD READ THEM WITH A FOX.
    I WILL READ THEM IN A HOUSE.
    EVEN IF IT HAS A MOUSE.
    I LIKE READING HERE AND THERE.
    I WILL SERIOUSLY READ ANYWHERE.
    I’D LIKE TO READ BOOKS AND TRAVEL LATAM.
    I WANT TO READ AND TRAVEL THE WORLD, FOR SREE I AM.

    A TRAIN! A TRAIN! A TRAIN! A TRAIN!
    COULD YOU, WOULD YOU ON A TRAIN?”

    Yeah, of course, duh, see the above. Sleeper car with a big window. EuroRail through the Alps?

    Sign. Me. Up.

    Now, what I will not do, Sree I am, is deal anymore with the Goodreads and Amazon sham. It’s been a pain finding books, having to search in Goodreads and then add them to an Amazon list. And then periodically go back and cycle through various searches and sites to find the best option: do we go with Apple eBooks, Kindle, Amazon used (if available) Thriftbooks, Libby, etc? Each search takes time, takes mental space, and if you do purchase outside of the Amazon list, you have to manage the list itself.

    I also don’t like giving Amazon that much of my data. My reading preferences feel significantly more personal than the supplements I take, the cleaning supplies I buy, or the excessive amount of glitter and markers I purchase (for my child, not myself…usually).

    So, I built Book Lover….well, I’m still building Book Lover. The MVP is mostly done. There’s some improvements to make. But here it is. I did this.
    https://www.loom.com/share/42b7d7867f4a4b35b99bdf21184e4b5f

    And then I showed it to a forum of strangers…and they loved it!

    So that made my year.

  • I love it when an ecosystem comes together…

    I love it when an ecosystem comes together…

    This was originally going to be a short post about one week with Codex. But after a discussion on a chat forum about favorite coding agents, I realized I wasn’t a Codex fan because it was Codex and had some magical ability. No, it was the unification of several tools from OpenAI: ChatGPT, CodexCLI, and Codex Desktop.

    This article from OpenAI about Codex’s app server came around the time that Clawdbot took off and the contrast in the two toolsets struck me as odd yet familiar. It feels very much like an Android vs Apple showdown. Clawdbot lets you install and infinitely customize to your heart’s content: connect anything and everything to your choice of systems: both computing platform and communications platforms of choice. It’s completely up to you. It’s also, completely up to you. Security, iteration, development, etc.

    Contrast that with OpenAI’s approach: interconnected tools with the ability to easily switch between. Codex CLI, Codex Web, and Codex for Mac. Integrated with ChatGPT and a limited, but user friendly set of tools. Very Apple.

    I, personally, fall in camp Apple. I like the guardrails. The training wheels. I know enough to get myself in trouble and I want enough to stay out of trouble. For the most part, I can do that in an intuitive way with Codex and ChatGPT. I can upload and organize a file set and projects with ChatGPT. The pretty colors for icons make me happy (yes, I am that simple of a man).

    I can do my research, drag and drop into folders, and get helpful suggestions. I can add in memories, update my preferences and overall, slowly but surely customize the experience to my level of comfort. I even recently upgraded to a business license and was able to find easily accessible guides on how to migrate everything from my initial Pro plan to Business….there was a Button! So user friendly!

    And Codex. Oh how I love Codex.

    I love plan mode on the web.

    It took me longer than I care to admit to learn a simple learning hack: fork a repo from a developer whose work you are curious about. Point Codex Web at the forked repo, and ask as many questions as you can to understand what’s going on. Ask about how it works, why it works, what the architectural principles are. Ask if it’s useful for your life (it pulls in your ChatGPT profile and memories as part of its assessment – which, for me, eloquently outlines my baseline need for explaining things like im five).

    And if you so choose, connect Github and build! The environment management, branch management are wonderful. Yes, it should be baked into every developers workflow. But I am not a developer. I am two raccoons and a lost toddler in a trench coat somehow gainfully employed in 21st century America.

    And with that hard earned trust, I was persuaded to push my comfort zone into Codex CLI. Easy install, easy troubleshooting (python is mapped as python3 on my computer and doesn’t like npm for some reason), and together, we built things.

    I thoroughly enjoyed using the CLI. All the articles that I had read about “it’s all just files, man” and “TUI is the way to go”

    (TUI = Terminal UI…yes, it took me forever to decipher that one as well)

    We researched things. We built skills one at a time together. We worked on context windows and compaction and orchestration.

    I was even delicately handheld through setting up my first MCP and using it to create my Notion EOD log (see: Codex Codex on the Wall…)

    It all just….worked.

    In what I believe to be an extremely controversial take, I will say I loved NOT drowning in the chaos of the Claude Code universe: the skills vs agent debates, the Ralph loop hysteria, the multi-agent orchestration empires currently ruled over by Clawdbot and Gas Town and the like. It feels like listening to an F1 crew trying to convey wisdom to a newly licensed teen driver. You’re wisened, experienced, and trying to be helpful…I’m just trying to merge onto the highway and not die (both from an accident…and from embarrassment).

    I’m a simple guy:

    I like having a job where I sit at a computer and say things and somehow it pays my mortgage and affords me time and resources to blather on the internet like someone’s listening.

    I like the potential and promise of AI. It truly fascinates me that a corpus of knowledge of a species has been aggregated into a form that is accessible faster than the neurological constructs that produced it. It’s Fucking Wild.

    And, I like building cool shit with cool people.

    But, I’m an amateur. I’m not yet at a level where I can generate an ROI on my AI work, and I certainly don’t have the ears of any VCs. I don’t think I’m unique either.

    And so when Codex came out with the Desktop app, I was curious, and then thrilled. It not only was the desktop GUI experience that I didn’t know I needed, but it also bridged the web and CLI worlds so smoothly. My skills showed up! My planning showed up! My development work to date showed up!

    Could this have been done in other tools? absolutely. But with the Codex app, it was all there, done for me from day one. Again, it just worked. The baseline is taken care of. And with that I can take the advice of the pros: pick a tool and master it. I can move up one ladder with Codex a rung at a time.

    And eventually, see the forest for the trees.

  • Codex, Codex on the wall, explain me the workings of this function call…

    Codex, Codex on the wall, explain me the workings of this function call…

    So, I think I’m a Codex Stan. Or, just too lazy to learn Cursor + Antigravity + Claude + Ralph Wiggum loops + OpenClaw + whatever is coming out of the woodwork these days. Yes, I do still check-in and dabble in other models, but there’s something elegant about a unified ecosystem with OpenAI. ChatGPT + Codex CLI + now, the Codex Mac Desktop app. It all fits together nicely. Also, I can’t justify $200 a month for a single subscription. Mostly that. So business plans with 2 seats for Codex works really really well for my wallet.

    And with it not being the most popular option, it does have a nice side benefit – I have to adapt everything I read to fit what I’m attempting to do. Which forces me to decompose and then recompose. TOML vs JSON, custom creation of skills (albeit still pretty damn easy with skill-creator and skills.md files at the core), and a different level of custom orchestration for multi-agent workflows.

    It’s fun. I’m learning. And for now, as the ecosystem works itself out, I tell myself that’s what matters. I’m not knowledgeable enough or positioned close enough to the bleeding edge to take advantage of the volatility. I’m working on an app that lets me keep track of books I want to buy – not writing new languages (looking at you Geoffrey Huntley).

    And so I did just that.

    I fired up Codex in a browser (Codex Cloud), navigated another tab to the OpenClaw repo, hit the fork button for maybe the second time in my life (yes, I said I’m learning – this is learning), and then asked Codex to explain the newly forked repo. And it told me about it. The features, how the Heartbeat works, security considerations, and how I could do something similar for my non-Telegram, non-WhatsApp using self.

    In retrospect, it’s so simple and obvious that I’m the only one who should be impressed.

    But wait, there’s more…

    I wanted to build a connection to my Notion site from the Codex CLI. I document all my ideas in Notion, I journal in Notion, I keep track of lists and feelings and statuses in Notion. If you forced me to choose between losing my iPhone or my Notion, I’d delete Notion off the phone and hand it right over without hesitation.

    And so I asked Codex to walk me through setting up the Notion MCP, creating a skill to read and write pages, and give me a brief tutorial on what it could or could not do.

    Codex chugged away, got me connected with the Notion MCP, and displayed a brief list of available tools. At that point, it was late in the night, and I have a routine before bed to plan my next day.

    And with this, I had an idea. Could I just ask Codex to write a memo for me? Something simple to start: check the weather for my area, suggest an outfit, format it all pretty, and show me in Notion. The iPhone app is one of the first things I check in the morning, and one of the last things I journal into at night so it’s a core information hub for organizing my thoughts and life.

    So I asked.

    A few minutes later this showed up:

    MAGIC!

    And now it’s a skill I can use whenever I want.

    Next step for me is automating it. I’ll work on a skill that writes an end of day briefing: a summary of what I worked on today (in Codex), some notes or ideas I want to add in, and a quick pre-cap of what tomorrow brings.

    Let’s see how it goes.

    Okay, never mind, it took like 30 minutes:

    MAGIC!!

  • Ain’t Nothing But a Country Thing

    Ain’t Nothing But a Country Thing

    While lobster red is all the hype right now through OpenClaw (fka Moltbot fka Clawdbot), I haven’t taken part. I’m curious to see how it evolves and what the scene looks like when the dust settles in a couple weeks.

    Speaking of dust, I’ve been on a bit of a country music kick lately. Nothing fancy: lots of pop country, some Garth Brooke, Keith Urban, and early Taylor Swift with Florida Georgia Line, Taylor Hubbard, Nate Smith, and others. And I definitely noticed the pattern: beer, dogs, trucks, and scorned love, and small town living. So, when guitar twang collided with AI agent, I came up with a small experiment: how prevalent is the common trope in country music? And with the trusty help of Codex CLI and some ChatGPT, I dove in to concocting a plan and building a visualization.

    As a side note, I have had a fascination with data science and data visualization. (not to brag, but I’ve had a Flowing Data membership since the beginning). Some minor experience through consulting work in PowerBI and Tableau at an enterprise level, but zero actual skill: just a not so quiet geeky admiration of the power of telling a good data backed story in the most human of senses: visualization.

    Here’s how it all went down (and yes, I got AI to write the post-mortem)

    Tag: Data

    • understand the zeitgeist from popular song lyrics

    Scope narrowing: I wanted to see the mentions of trucks, dogs, beer, and girlfriends in country music over the years. So, I figured I could pull a list of top 100 country songs since 2000, their lyrics, and do a keyword frequency search.

    This was harder than I thought. But here’s what a few hours of Codex came up with:

    and a cool split view

    I even got Codex to write a Post Mortem document in Markdown. Is the data accurate? Based on a quick assessment, I don’t think so; there appears to be some sort of bias towards the later years where words are overrepresented in the data sets. This could be because of incompleteness of lyrics, inaccurate lists, double counting, appends, etc.

    Country Music Visualization Project Post Mortem

    Executive Summary

    This project set out to visualize how frequently a small set of words (beer, truck, dog, girlfriend, wife, sad, happy) appear in the lyrics of U.S. country songs that appear on year-end Top 100 lists from 2000 onward. The end result is an interactive, Observable Plot-based visualization with multiple frequency metrics, legend toggles, and a coverage warning overlay. We achieved the required coverage threshold (>70%) by combining a licensed bag-of-words corpus (LyricFind) with a large supplemental lyrics dataset from Kaggle. The final coverage was 84.56% overall, with some years still below threshold, and those years are explicitly highlighted in the visualization.

    Concept and Goals

    Primary concept: A long-run view of thematic language in country music using a stable, chart-based song universe.

    Goals

    • Analyze the frequency of target words and their variants across time.
    • Use year-end Top 100 lists so each year is comparable.
    • Provide multiple metrics (raw count, per 10k words, % of songs with the word).
    • Require a minimum lyric coverage threshold of 70% before computing results.
    • Produce an interactive, lightweight HTML/JS visualization using Observable Plot.

    Scope Decisions

    • Years: 2000–2024 (Playback.fm has no 2025 list). Each appearance of a song in a given year is counted separately.
    • Target words: beer, truck, dog, girlfriend, wife, sad, happy with plurals and possessives.
    • Chart sourcePlayback.fm year-end Top 100 country lists (used as a proxy due to access constraints). This is not an official Billboard dataset.
    • Lyrics source: LyricFind corpus (bag-of-words) plus a Kaggle lyrics dataset to fill coverage gaps after 2013.

    Data Sources

    1. Playback.fm year-end country charts (2000–2024)
    2. LyricFind Corpus (bag-of-words)
    3. Kaggle supplemental lyrics dataset

    Planning and Workflow

    Planning steps

    • Define the list universe and target words.
    • Identify and validate data sources for chart lists and lyrics.
    • Implement a pipeline to build the song list, retrieve/ingest lyrics, compute metrics, and visualize results.
    • Enforce a minimum coverage threshold (>=70%).
    • Add transparency mechanisms (coverage report + visualization overlay).

    Scripts and artifacts

    • scripts/build_song_list.py: Builds year-end lists (Playback.fm parsing and other sources).
    • scripts/fetch_lyrics.py: Downloads/unzips LyricFind.
    • scripts/compute_word_freqs.py: Computes word metrics and coverage.
    • data/raw/year_end_country_songs_2000_2025.csv: Song universe (2000–2024 used).
    • data/processed/word_freqs_by_year.csv: Aggregated metrics by year.
    • data/processed/coverage_report.json: Coverage diagnostics by year.
    • viz/index.htmlviz/plot.jsviz/styles.css: Visualization.

    Methodology

    1. Build song universe
      • For each year, collect Top 100 country songs.
      • Normalize song titles and artist names.
      • Each song is counted per year it appears.
    2. Lyrics ingestion
      • LyricFind dictionary is used to map word IDs to tokens.
      • Lyrics file provides word IDs per lyric (bag-of-words).
      • Metadata maps lyric IDs to titles/artists.
      • Cross-reference file maps duplicate lyric IDs to distinct IDs.
    3. Supplemental lyrics
      • Kaggle dataset provides full lyrics for many tracks.
      • For songs missing in LyricFind, attempt matching by normalized title + artist.
    4. Word matching
      • Variants include plurals and possessives.
      • Matching is exact-token after normalization (lowercase, punctuation stripped).
    5. Metrics computed
      • Raw count of each word group per year.
      • Occurrences per 10,000 words per year.
      • Percentage of songs containing the word per year.
    6. Coverage enforcement
      • Compute overall and per-year coverage of songs with lyrics.
      • Exit if overall coverage <70%.
      • Add visual warnings for low coverage years.

    Execution Summary

    • Playback.fm parsing was done via browser automation due to sandbox networking constraints.
    • LyricFind corpus was manually downloaded and unzipped in the project directory.
    • Initial coverage with LyricFind alone was 45.92% (coverage dropped sharply after 2013).
    • Kaggle supplemental lyrics added 803 additional song matches.
    • Final coverage reached 84.56% overall.

    Coverage (selected years)

    • 2000–2012: ~80%+ coverage
    • 2013: 79%
    • 2014: 84%
    • 2015: 83%
    • 2023: 57%
    • 2024: 13%

    Visualization Features

    • Metric dropdown (raw count, per 10k words, % of songs with word).
    • Legend toggles by word category.
    • Coverage overlay: background shading by year (darker = lower coverage) plus dashed markers for years <70%.
    • Inline legend for coverage overlay.
    • Methodology and project notes section below the chart.

    Pain Points and Challenges

    1. Chart list reliability
      • Playback.fm is not official Billboard data. This introduces uncertainty in the actual chart universe.
    2. Lyrics availability
      • LyricFind corpus coverage drops sharply after ~2013.
      • Supplemental lyrics were required to reach 70% coverage.
    3. Environment constraints
      • Network restrictions prevented direct downloads and scraping.
      • Manual downloads and browser scraping were needed.
    4. Matching accuracy
      • Title/artist normalization can mis-handle remixes, alternate names, and common titles.
      • Matching errors can introduce false positives or missed matches.

    Lessons Learned

    • Coverage transparency is essential; a clean overlay prevents misleading interpretations.
    • Mixing data sources is practical but must be disclosed (format and provenance differ).
    • Normalization rules matter as much as the source lists; artist disambiguation is critical.
    • A robust pipeline needs versioned artifacts and per-year validation checks.

    Data Accuracy Assessment

    Strengths

    • Strong coverage for 2000–2012 and many mid-years after supplementation.
    • A clear, repeatable matching methodology and consistent metrics.

    Limitations

    • Playback.fm may diverge from Billboard year-end data.
    • Kaggle lyrics dataset may include non-country songs and varying metadata quality.
    • 2023–2024 have low coverage, and values for those years are likely undercounted.

    Narratives the Visualization Supports

    • Broad trend comparisons for target words over time.
    • Relative prominence of certain themes (e.g., beer vs dog vs sad) in charting country songs.
    • Periods of shift in language emphasis across decades.

    Are These Narratives Accurate?

    • Mostly accurate for years with high coverage (especially 2000–2012, 2014–2022).
    • Potentially inaccurate for 2023–2024 due to low coverage.
    • Potentially biased if Playback.fm diverges from Billboard official lists.

    Improving Narrative Quality

    • Add a filter toggle to hide years below 70% coverage.
    • Include per-year coverage values in tooltips.
    • Provide a short narrative annotation noting low-coverage years.
    • Use official Billboard lists or licensed chart datasets to remove list-source bias.

    Answers to the Analyst Questions

    1) Methodology and data sources used

    • Playback.fm year-end Top 100 country lists (2000–2024) as the chart universe.
    • LyricFind bag-of-words corpus as the primary lyrics source.
    • Kaggle Spotify lyrics dataset as a supplemental source.

    2) Improvements to the pipeline/process

    • Use official Billboard year-end lists or licensed chart data.
    • Add fuzzy matching with confidence scores and manual QA samples.
    • Track data lineage and source versions with hashes.
    • Add automated tests for parsing and matching.

    3) Ways to upgrade the visualization

    • Add a coverage filter toggle.
    • Add tooltips with coverage and counts.
    • Use small-multiples (one per word) for readability.
    • Add a coverage heatmap band under the x-axis.

    4) Accuracy of the data

    • High for 2000–2012 and many mid-years; low for 2023–2024.
    • Playback.fm list is a significant external accuracy risk.

    5) Narratives and conclusions supported

    • Trends and relative prevalence of target words across time.
    • Comparative framing across words and metrics.

    6) Are narratives accurate?

    • Yes for high-coverage years; questionable for low-coverage years.
    • List-source bias remains a structural risk.

    7) How to improve narratives

    • Make low-coverage years opt-in.
    • Report confidence explicitly in the UI.
    • Use official charts and a single lyrics source for consistency.

    Future Improvements

    • Integrate official Billboard data (licensed or verified dataset).
    • Add a standardized fuzzy-matching pipeline with confidence scoring.
    • Create a validation sample set for manual review.
    • Build a provenance report embedded in the UI.
    • Explore sentiment or topic modeling beyond simple word counts.

    Final Takeaway

    The visualization provides a useful, transparent view of word frequency trends in country lyrics from 2000–2024. The inclusion of a coverage overlay protects against over-interpreting thin data years. The most significant limitation is chart-source accuracy (Playback.fm vs Billboard) and uneven lyric coverage in recent years. With an official chart source and a consistent, licensed lyrics dataset, this approach could be made production-grade.

  • The Inevitable Rematch: Man vs Machine

    The Inevitable Rematch: Man vs Machine

    This isn’t fully fleshed out, but I had to get it in writing and published. At some point in the future, I can course correct or look back and see the origin story.

    Every AI agent demo begins the same way.

    A sentence is typed.

    The system responds.

    Somewhere, something gets done.

    It feels like a sleight of hand trick: no menus, no training manuals, no clicking through brittle interfaces built for another era. Just intent, expressed in plain language, translated into action.

    It’s supposed to feel futuristic, harkening The Jetson’s. Magical

    But the work didn’t disappear.

    It just moved offscreen.


    The Return of John Henry

    AI made a very explicit and bold promise: tell the system what you want, and it will figure out how to do it. No more rigid workflows. No more translating human intent into machine ceremony. AI agents would reason, decide, and act. All you had to do was ask.

    For organizations who couldn’t pack in enough training sessions, and change management programs that never quite stuck, this was supposed to be a huge difference, a shift in the paradigm. A way to collapse complexity without rebuilding everything underneath it AND recoup operational expenditure.

    And to be clear, something real has happened. Things have shifted.

    But the shift isn’t what it’s often framed to be.

    In practice, agents don’t decide. They choose from a predefined set of actions that someone else has already made safe: fetch this record, update that field, trigger that workflow, escalate this case. Each of those actions must be explicitly defined, permissioned, mapped to data models, and guarded against failure paths. None of it is automatic. None of it is emergent.

    For an agent to appear autonomous, someone must first do the very human work of understanding the system deeply enough to constrain it. Requirements have to be broken down. Edge cases have to be anticipated. Judgment has to be encoded into deterministic paths the machine can follow without embarrassing anyone.

    The legend of John Henry has re-emerged in the 21st century.

    In the legend, John Henry competes against a steam powered drill that builds railroads. He wins the contest but dies from the effort. The story is often told as man versus machine, but that misses the point. In fact, it was never a fair fight. John Henry had to line up the spike, swing the hammer, and drive the spike down. There was significant effort in calibrating each iteration of work, along with a full reset when moving to the next drill. The machine had that calibration and reset programmed into it far before the race even started.

    John Henry didn’t lose because he was inefficient or slow. He lost because the human aspects of work were shifted out of the race.

    Today’s John Henry isn’t swinging a hammer. He’s configuring actions, defining guardrails, debugging edge cases, and translating messy human needs into machine-safe behavior. He survives. But he disappears. His work no longer looks like work. It looks like infrastructure.

    And infrastructure rarely gets credit.

    This is why it’s useful to stop talking about agents as an intelligence breakthrough and start talking about them as something else entirely: a user interface convenience.

    Agents don’t automate work so much as they collapse interfaces. They turn navigation into language, menus into intent, and process discretion into a single text prompt. Instead of a human learning, training, and knowing which page to open update a record and which button to click to edit, override, and save, you type a sentence. The system does the clicking for you. But that sequence isn’t something AI figured out. Someone codified it before you started. They defined the sequence, wrote the scripts, and presented them like a la carte offerings to a hungry AI. All it had to do was pick and consume. Voila, a magic AI! See how it works! You wouldn’t believe it wasn’t a person!

    The human that made it all happen? Gone. Obfuscated. Relegated to implementation.

    With this shift, the trade-off becomes more apparent and a new metric begins to emerge. For conversation, let’s call it the “click-to-key” ratio: how many navigational actions are replaced by typing into a prompt —and how much hidden labor is required to make that translation reliable.

    Consider a simple thought experiment. If an agent replaces twelve clicks with a sentence, how many hours did it take to make that sentence safe? Those hours didn’t vanish. They moved upstream, into design, configuration, testing, and maintenance. If the prompt is X % faster, how many times does the prompt have to be run to return a better investment of resources? On the original “clicks” side – you have build time, training time, click time, page load time, and the inevitable “oops, clicked the wrong thing, gotta undo that” time. On the agent side, you have build time, less training time (in theory), typing time, AI processing and load time, and the occasional “it did the wrong thing and maybe someone will catch it”….and even some “it did the wrong thing and no one will find out till much later when the cost to unwind it will be disproportionately large due to compounding effects”.

    This shift explains a familiar pattern inside organizations. Every time leadership celebrates an agent, someone else just learned a new internal scripting language or got very good at requirements elicitation. Not because anyone failed, but because the original promise was impossible. Software can collapse interfaces, but it can’t eliminate the need for human judgment. It can only hide where that judgment lives.

    And, I think this is why AI initiatives so often disappoint on ROI. The issue usually isn’t execution. It’s framing. The value proposition was sold as labor replacement, but the value delivered was friction reduction. Reducing friction is powerful, but it doesn’t remove the need for skilled humans. Agents work best when the underlying system is well understood, when judgment is encoded carefully, and when empathy for end users shapes the design. In other words, when the most human humans are involved—people who are fluent in both technology and the people it’s meant to serve.

    I’m curious to see in 2026 where John Henry shows up. And if the shift in work and and human obfuscation becomes more apparent, or more highlighted.

    Either way, the machine is here, and the hammer keeps swinging.

  • 2026, I’m back to betting on myself…

    2026, I’m back to betting on myself…

    It all boils down to a simple resolution: Publish More.

    That’s it. Nothing fancy, not even physically difficult. Continue to tinker and build things, and then, one small tweak: release them to the wilds of the internets.

    No one has to see them, but they can be found.

    No one has to like them, but they can be judged.

    No one needs to know, but they can be known.

    And for me that’s terrifying. It’s a far shift from perfectionism. From doing the extra homework to “get it right” and have “the answer” like I do at work. No boss to judge, to please, to provide feedback. Just me seeing where I can let my own hand take me; with the secret, undying, scary-but-exhilarating-and-probably-conceited hope that it might just go somewhere amazing.

    At barely 30 days in, there are no results yet, no indicators of direction, no feedback, nothing.

    But I am having fun.

    Here’s the latest things I’ve built. First up, a simple Truth or Dare python app. I wanted to build a local library of prompts and calls to action that will help me work my emotional and mental resiliency. I used Codex to build out a v1, and then upgraded it with an ability to pull down further questions from online sources.

    It’s small, it’s lightweight, and it punches far above anything I could have built on my own in a weekend. I love how, with some thinking, a few prompts, and a solid test plan, I can build tools to extend my self. I can improve my self-improvement.

    And that wasn’t the only thing I built. I wanted to test out a real use of an MCP, and decided to use Perplexity’s Search API. I have a more than passing curiosity about Formula 1 and with the latest news about the upcoming 2026 season, I wanted to see if I could use Codex + Perplexity MCP to build my own 2026 F1 Season Tracker. Setting up the MCP was easy enough, updated the config.toml file (See screenshot below)

    …And that was it. I had to re-generate and update my Perplexity key once due to some finickiness on my end (I had no chill and didn’t follow the ridiculously easy instructions in order). And then restarted Codex. I first prompted Codex to search for the full 2026 F1 lineup: teams, race dates, locations, drivers. Codex chose to use the Perplexity MCP, pulled a bunch of information together, and then formatted it into a nice table.

    Then, here’s the fun part, I told it to build me an F1 tracker as a webpage with racing themed styling, and some modern animations. Nothing else. And then this beauty showed up.

    A few of the dates are wrong; and I think that’s from a timezone / daylight savings time conversion of sorts.

    But look at it! Track outlines with animation. Clean formatting, a world map with pins you can hover on. A date countdown. To me, the seamless handoff between research prompt and visualization is amazing. With this proof of concept, I can see quite a few use cases centered around compiling deep research data and visualizations. In my running Notion page titled “Idea List, Brain Dump, Thoughts, Musings, Future Explorations” I keep a tally of future “experiments”. One of them is to get a sense of the shift in social norms through popular songs and lyrics. I have barely any idea of how to go about it other than to pull a bunch of song lyrics, analyze them for recurring patterns, and then show them in a visualization. There’s a ton of skillsets required, probably a few advanced degrees, and definitely some career experience required to do this for fun. But now, I think I might be able to dabble and indulge a whim. Or at the very least, understand how out of my depth I might be.

    All in a few hours of work and one half-pint of Ben & Jerry’s!

  • I Built a Thing!

    I Built a Thing!

    I know. I’ve been talking about showing something I’ve but for quite some time now. I finally have something.

    Here it is. It’s a small D3JS rendered Process Tree that I built to outline an area I work with heavily: non-profit operations.

    As a consultant, I specialize in helping non-profits operationalize their technology: which is a fancy way of saying I ask questions, break down processes, and find ways for technology help streamline and enhance it. I built this process tree in order to help other non-nonprofit consultants get up to speed on what is really an entirely different world from the usual for-profit companies that they’re used to (we’re a small but mighty contingent). A tool like this enables consultants that I work with to make the most of what they’re doing, get up to speed quickly and help our clients more efficiently. It’s certainly faster and more reference able than a YouTube video, a bunch of articles, or asking me every question they can think of, when they think of it via Teams.

    One of the things that I’m really proud of is that this process tree (although it’s in a very simplistic original form and will need a lot of enhancements) takes a consultant who wants to effect positive change in the world, but may struggle with the barrier of entry into this insular world, and gives them the reference tools and confidence to do operate in a world that they may not be used to; it opens the door to a broader pool of resources who can help our non-profits do more with what resources they have. Especially in a time where the availability of those are far from certain and liable to change at any moment.

    I built this with Codex. In one weekend. I did a lot of the research and Codex extended it. It formatted it into the visualization you see. Right now it just runs on a local server. But it’s small, and it might be ugly, but I love it and it’s mine, and to me, it’s just short of superpowers.

    https://www.loom.com/share/c141a6ab4cf84853a2fb856baf8ce63f