While lobster red is all the hype right now through OpenClaw (fka Moltbot fka Clawdbot), I haven’t taken part. I’m curious to see how it evolves and what the scene looks like when the dust settles in a couple weeks.
Speaking of dust, I’ve been on a bit of a country music kick lately. Nothing fancy: lots of pop country, some Garth Brooke, Keith Urban, and early Taylor Swift with Florida Georgia Line, Taylor Hubbard, Nate Smith, and others. And I definitely noticed the pattern: beer, dogs, trucks, and scorned love, and small town living. So, when guitar twang collided with AI agent, I came up with a small experiment: how prevalent is the common trope in country music? And with the trusty help of Codex CLI and some ChatGPT, I dove in to concocting a plan and building a visualization.
As a side note, I have had a fascination with data science and data visualization. (not to brag, but I’ve had a Flowing Data membership since the beginning). Some minor experience through consulting work in PowerBI and Tableau at an enterprise level, but zero actual skill: just a not so quiet geeky admiration of the power of telling a good data backed story in the most human of senses: visualization.
Here’s how it all went down (and yes, I got AI to write the post-mortem)
Tag: Data
- understand the zeitgeist from popular song lyrics
Scope narrowing: I wanted to see the mentions of trucks, dogs, beer, and girlfriends in country music over the years. So, I figured I could pull a list of top 100 country songs since 2000, their lyrics, and do a keyword frequency search.
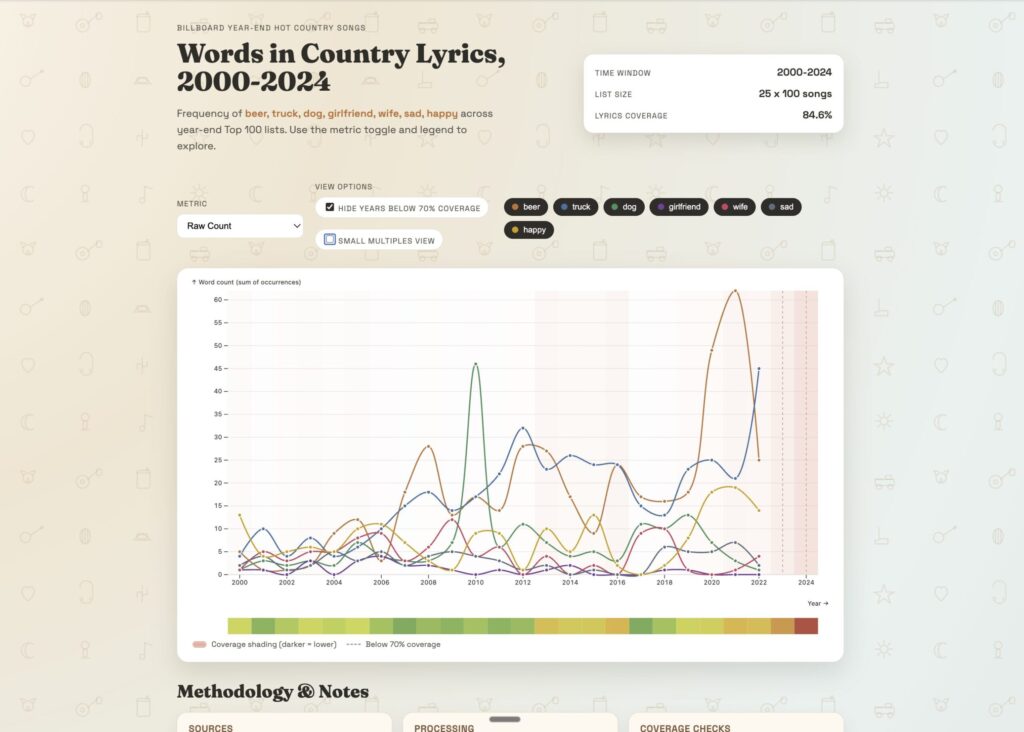
This was harder than I thought. But here’s what a few hours of Codex came up with:
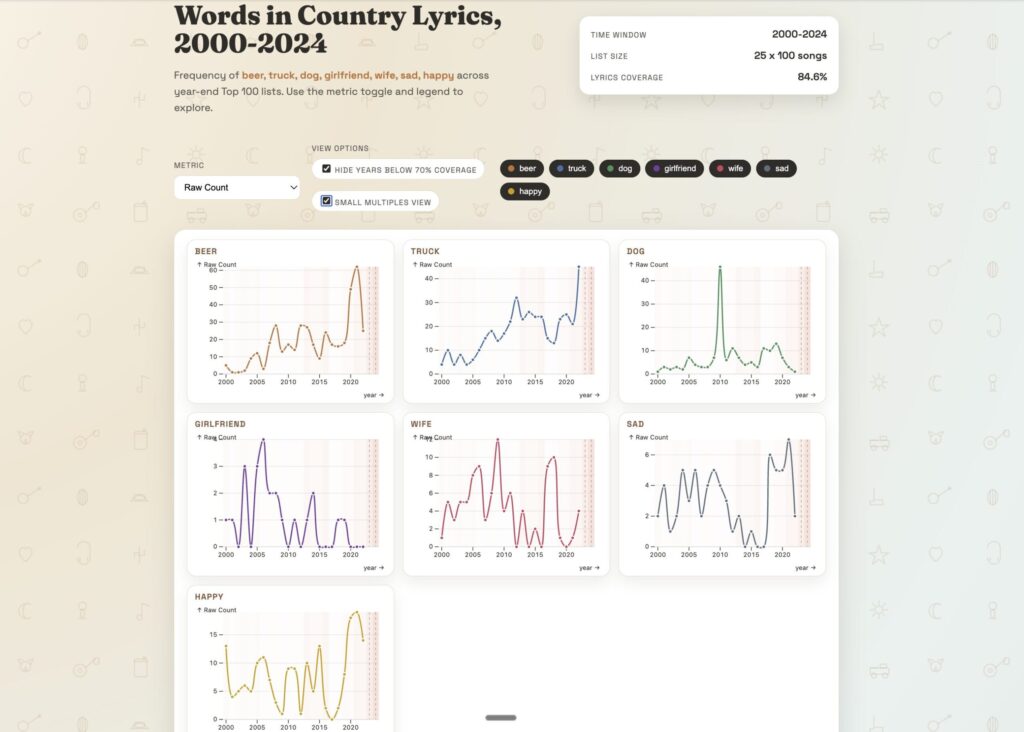
and a cool split view
I even got Codex to write a Post Mortem document in Markdown. Is the data accurate? Based on a quick assessment, I don’t think so; there appears to be some sort of bias towards the later years where words are overrepresented in the data sets. This could be because of incompleteness of lyrics, inaccurate lists, double counting, appends, etc.
Country Music Visualization Project Post Mortem
Executive Summary
This project set out to visualize how frequently a small set of words (beer, truck, dog, girlfriend, wife, sad, happy) appear in the lyrics of U.S. country songs that appear on year-end Top 100 lists from 2000 onward. The end result is an interactive, Observable Plot-based visualization with multiple frequency metrics, legend toggles, and a coverage warning overlay. We achieved the required coverage threshold (>70%) by combining a licensed bag-of-words corpus (LyricFind) with a large supplemental lyrics dataset from Kaggle. The final coverage was 84.56% overall, with some years still below threshold, and those years are explicitly highlighted in the visualization.
Concept and Goals
Primary concept: A long-run view of thematic language in country music using a stable, chart-based song universe.
Goals
- Analyze the frequency of target words and their variants across time.
- Use year-end Top 100 lists so each year is comparable.
- Provide multiple metrics (raw count, per 10k words, % of songs with the word).
- Require a minimum lyric coverage threshold of 70% before computing results.
- Produce an interactive, lightweight HTML/JS visualization using Observable Plot.
Scope Decisions
- Years: 2000–2024 (Playback.fm has no 2025 list). Each appearance of a song in a given year is counted separately.
- Target words: beer, truck, dog, girlfriend, wife, sad, happy with plurals and possessives.
- Chart source: Playback.fm year-end Top 100 country lists (used as a proxy due to access constraints). This is not an official Billboard dataset.
- Lyrics source: LyricFind corpus (bag-of-words) plus a Kaggle lyrics dataset to fill coverage gaps after 2013.
Data Sources
- Playback.fm year-end country charts (2000–2024)
- https://playback.fm/charts/country
- Used as proxy for Billboard year-end lists.
- LyricFind Corpus (bag-of-words)
- https://www.smcnus.org/lyrics/
- Dataset includes a dictionary, lyrics as word IDs, cross-reference file, and metadata.
- Kaggle supplemental lyrics dataset
- https://www.kaggle.com/datasets/bwandowando/spotify-songs-with-attributes-and-lyrics
- Used to improve coverage for 2014–2024.
Planning and Workflow
Planning steps
- Define the list universe and target words.
- Identify and validate data sources for chart lists and lyrics.
- Implement a pipeline to build the song list, retrieve/ingest lyrics, compute metrics, and visualize results.
- Enforce a minimum coverage threshold (>=70%).
- Add transparency mechanisms (coverage report + visualization overlay).
Scripts and artifacts
scripts/build_song_list.py: Builds year-end lists (Playback.fm parsing and other sources).scripts/fetch_lyrics.py: Downloads/unzips LyricFind.scripts/compute_word_freqs.py: Computes word metrics and coverage.data/raw/year_end_country_songs_2000_2025.csv: Song universe (2000–2024 used).data/processed/word_freqs_by_year.csv: Aggregated metrics by year.data/processed/coverage_report.json: Coverage diagnostics by year.viz/index.html,viz/plot.js,viz/styles.css: Visualization.
Methodology
- Build song universe
- For each year, collect Top 100 country songs.
- Normalize song titles and artist names.
- Each song is counted per year it appears.
- Lyrics ingestion
- LyricFind dictionary is used to map word IDs to tokens.
- Lyrics file provides word IDs per lyric (bag-of-words).
- Metadata maps lyric IDs to titles/artists.
- Cross-reference file maps duplicate lyric IDs to distinct IDs.
- Supplemental lyrics
- Kaggle dataset provides full lyrics for many tracks.
- For songs missing in LyricFind, attempt matching by normalized title + artist.
- Word matching
- Variants include plurals and possessives.
- Matching is exact-token after normalization (lowercase, punctuation stripped).
- Metrics computed
- Raw count of each word group per year.
- Occurrences per 10,000 words per year.
- Percentage of songs containing the word per year.
- Coverage enforcement
- Compute overall and per-year coverage of songs with lyrics.
- Exit if overall coverage <70%.
- Add visual warnings for low coverage years.
Execution Summary
- Playback.fm parsing was done via browser automation due to sandbox networking constraints.
- LyricFind corpus was manually downloaded and unzipped in the project directory.
- Initial coverage with LyricFind alone was 45.92% (coverage dropped sharply after 2013).
- Kaggle supplemental lyrics added 803 additional song matches.
- Final coverage reached 84.56% overall.
Coverage (selected years)
- 2000–2012: ~80%+ coverage
- 2013: 79%
- 2014: 84%
- 2015: 83%
- 2023: 57%
- 2024: 13%
Visualization Features
- Metric dropdown (raw count, per 10k words, % of songs with word).
- Legend toggles by word category.
- Coverage overlay: background shading by year (darker = lower coverage) plus dashed markers for years <70%.
- Inline legend for coverage overlay.
- Methodology and project notes section below the chart.
Pain Points and Challenges
- Chart list reliability
- Playback.fm is not official Billboard data. This introduces uncertainty in the actual chart universe.
- Lyrics availability
- LyricFind corpus coverage drops sharply after ~2013.
- Supplemental lyrics were required to reach 70% coverage.
- Environment constraints
- Network restrictions prevented direct downloads and scraping.
- Manual downloads and browser scraping were needed.
- Matching accuracy
- Title/artist normalization can mis-handle remixes, alternate names, and common titles.
- Matching errors can introduce false positives or missed matches.
Lessons Learned
- Coverage transparency is essential; a clean overlay prevents misleading interpretations.
- Mixing data sources is practical but must be disclosed (format and provenance differ).
- Normalization rules matter as much as the source lists; artist disambiguation is critical.
- A robust pipeline needs versioned artifacts and per-year validation checks.
Data Accuracy Assessment
Strengths
- Strong coverage for 2000–2012 and many mid-years after supplementation.
- A clear, repeatable matching methodology and consistent metrics.
Limitations
- Playback.fm may diverge from Billboard year-end data.
- Kaggle lyrics dataset may include non-country songs and varying metadata quality.
- 2023–2024 have low coverage, and values for those years are likely undercounted.
Narratives the Visualization Supports
- Broad trend comparisons for target words over time.
- Relative prominence of certain themes (e.g., beer vs dog vs sad) in charting country songs.
- Periods of shift in language emphasis across decades.
Are These Narratives Accurate?
- Mostly accurate for years with high coverage (especially 2000–2012, 2014–2022).
- Potentially inaccurate for 2023–2024 due to low coverage.
- Potentially biased if Playback.fm diverges from Billboard official lists.
Improving Narrative Quality
- Add a filter toggle to hide years below 70% coverage.
- Include per-year coverage values in tooltips.
- Provide a short narrative annotation noting low-coverage years.
- Use official Billboard lists or licensed chart datasets to remove list-source bias.
Answers to the Analyst Questions
1) Methodology and data sources used
- Playback.fm year-end Top 100 country lists (2000–2024) as the chart universe.
- LyricFind bag-of-words corpus as the primary lyrics source.
- Kaggle Spotify lyrics dataset as a supplemental source.
2) Improvements to the pipeline/process
- Use official Billboard year-end lists or licensed chart data.
- Add fuzzy matching with confidence scores and manual QA samples.
- Track data lineage and source versions with hashes.
- Add automated tests for parsing and matching.
3) Ways to upgrade the visualization
- Add a coverage filter toggle.
- Add tooltips with coverage and counts.
- Use small-multiples (one per word) for readability.
- Add a coverage heatmap band under the x-axis.
4) Accuracy of the data
- High for 2000–2012 and many mid-years; low for 2023–2024.
- Playback.fm list is a significant external accuracy risk.
5) Narratives and conclusions supported
- Trends and relative prevalence of target words across time.
- Comparative framing across words and metrics.
6) Are narratives accurate?
- Yes for high-coverage years; questionable for low-coverage years.
- List-source bias remains a structural risk.
7) How to improve narratives
- Make low-coverage years opt-in.
- Report confidence explicitly in the UI.
- Use official charts and a single lyrics source for consistency.
Future Improvements
- Integrate official Billboard data (licensed or verified dataset).
- Add a standardized fuzzy-matching pipeline with confidence scoring.
- Create a validation sample set for manual review.
- Build a provenance report embedded in the UI.
- Explore sentiment or topic modeling beyond simple word counts.
Final Takeaway
The visualization provides a useful, transparent view of word frequency trends in country lyrics from 2000–2024. The inclusion of a coverage overlay protects against over-interpreting thin data years. The most significant limitation is chart-source accuracy (Playback.fm vs Billboard) and uneven lyric coverage in recent years. With an official chart source and a consistent, licensed lyrics dataset, this approach could be made production-grade.